
EBK STATISTICS FOR BUSINESS & ECONOMICS
12th Edition
ISBN: 8220100460463
Author: Anderson
Publisher: CENGAGE L
expand_more
expand_more
format_list_bulleted
Concept explainers
Videos
Textbook Question
Chapter 15, Problem 53SE
Recall that in exercise 50 the personnel director for Electronics Associates developed the following estimated regression equation relating an employee’s score on a job satisfaction test to length of service and wage rate.
Where
x1 = length of service (years)
x2 = wage rate (dollars)
y = job satisfaction test score (higher scores indicate greater job satisfaction)
A portion of the Minitab computer output follows.
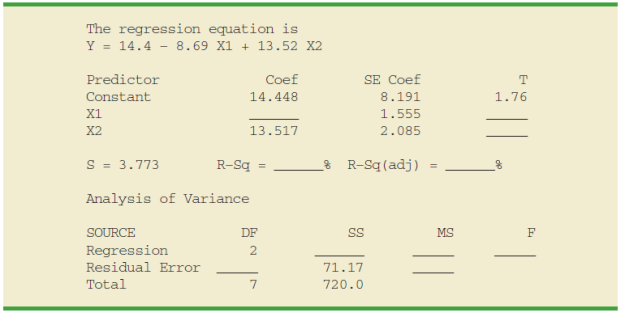
- a. Complete the missing entries in this output.
- b. Compute F and test using α = .05 to see whether a significant relationship is present.
- c. Did the estimated regression equation provide a good fit to the data? Explain.
- d. Use the t test and α = .05 to test H0: β1 = 0 and H0: β2 = 0.
Expert Solution & Answer

Trending nowThis is a popular solution!

Students have asked these similar questions
create graph of the two-variable data with a regression line, r, r2, and separate residual plot
Find the degrees of freedom in a regression model with an intercept term that has 88 observations and 7 explanatory variables.
The following table gives the data for the average temperature and the snow accumulation in several small towns for a single month. Determine the equation of the regression line, yˆ=b0+b1xy^=b0+b1x. Round the slope and y-intercept to the nearest thousandth. Then determine if the regression equation is appropriate for making predictions at the 0.010.01 level of significance.
Average Temperatures and Snow Accumulations
Average Temperature (℉℉)
38
30
17
39
45
22
34
24
29
38
Snow Accumulation (in.in.)
6
19
27
5
13
26
26
14
13
5
Copy Data
Chapter 15 Solutions
EBK STATISTICS FOR BUSINESS & ECONOMICS
Ch. 15.2 - The estimated regression equation for a model...Ch. 15.2 - Consider the following data for a dependent...Ch. 15.2 - In a regression analysis involving 30...Ch. 15.2 - A shoe store developed the following estimated...Ch. 15.2 - The owner of Showtime Movie Theaters, Inc., would...Ch. 15.2 - The National Football League (NFL) records a...Ch. 15.2 - PC World rated four component characteristics for...Ch. 15.2 - The Cond Nast Traveler Gold List provides ratings...Ch. 15.2 - Waterskiing and wakeboarding are two popular...Ch. 15.2 - Prob. 10E
Ch. 15.3 - In exercise 1, the following estimated regression...Ch. 15.3 - Prob. 12ECh. 15.3 - In exercise 3, the following estimated regression...Ch. 15.3 - In exercise 4, the following estimated regression...Ch. 15.3 - In exercise 5, the owner of Showtime Movie...Ch. 15.3 - In exercise 6, data were given on the average...Ch. 15.3 - Prob. 17ECh. 15.3 - Prob. 18ECh. 15.5 - In exercise 1, the following estimated regression...Ch. 15.5 - Refer to the data presented in exercise 2. The...Ch. 15.5 - The following estimated regression equation was...Ch. 15.5 - In exercise 4, the following estimated regression...Ch. 15.5 - Prob. 23ECh. 15.5 - The Wall Street Journal conducted a study of...Ch. 15.5 - The Cond Nast Traveler Gold List for 2012 provided...Ch. 15.5 - In exercise 10, data showing the values of several...Ch. 15.6 - In exercise 1, the following estimated regression...Ch. 15.6 - Refer to the data in exercise 2. The estimated...Ch. 15.6 - In exercise 5, the owner of Showtime Movie...Ch. 15.6 - Prob. 30ECh. 15.6 - The American Association of Individual Investors...Ch. 15.7 - Consider a regression study involving a dependent...Ch. 15.7 - Consider a regression study involving a dependent...Ch. 15.7 - Management proposed the following regression model...Ch. 15.7 - Refer to the Johnson Filtration problem introduced...Ch. 15.7 - This problem is an extension of the situation...Ch. 15.7 - The Consumer Reports Restaurant Customer...Ch. 15.7 - A 10-year study conducted by the American Heart...Ch. 15.8 - Data for two variables, x and y, follow. xi 1 2 3...Ch. 15.8 - Data for two variables, x and y, follow. xi 22 24...Ch. 15.8 - Exercise 5 gave the following data on weekly gross...Ch. 15.8 - The following data show the curb weight,...Ch. 15.8 - Prob. 43ECh. 15.9 - Refer to the Simmons Stores example introduced in...Ch. 15.9 - In Table 15.12 we provided estimates of the...Ch. 15.9 - Community Bank would like to increase the number...Ch. 15.9 - Over the past few years the percentage of students...Ch. 15.9 - The Tire Rack maintains an independent consumer...Ch. 15 - The admissions officer for Clearwater College...Ch. 15 - The personnel director for Electronics Associates...Ch. 15 - A partial computer output from a regression...Ch. 15 - Recall that in exercise 49, the admissions officer...Ch. 15 - Recall that in exercise 50 the personnel director...Ch. 15 - The Tire Rack, Americas leading online distributor...Ch. 15 - The Department of Energy and the U.S....Ch. 15 - A portion of a data set containing information for...Ch. 15 - Fortune magazine publishes an annual list of the...Ch. 15 - Consumer Research, Inc., is an independent agency...Ch. 15 - Matt Kenseth won the 2012 Daytona 500, the most...Ch. 15 - Finding the Best Car Value When trying to decide...
Knowledge Booster


Learn more about
Need a deep-dive on the concept behind this application? Look no further. Learn more about this topic, statistics and related others by exploring similar questions and additional content below.Similar questions
- What is regression analysis? Describe the process of performing regression analysis on a graphing utility.arrow_forwardDoes Table 1 represent a linear function? If so, finda linear equation that models the data.arrow_forwardTable 2 shows a recent graduate’s credit card balance each month after graduation. a. Use exponential regression to fit a model to these data. b. If spending continues at this rate, what will the graduate’s credit card debt be one year after graduating?arrow_forward
- What does the y -intercept on the graph of a logistic equation correspond to for a population modeled by that equation?arrow_forwardRespiratory Rate Researchers have found that the 95 th percentile the value at which 95% of the data are at or below for respiratory rates in breath per minute during the first 3 years of infancy are given by y=101.82411-0.0125995x+0.00013401x2 for awake infants and y=101.72858-0.0139928x+0.00017646x2 for sleeping infants, where x is the age in months. Source: Pediatrics. a. What is the domain for each function? b. For each respiratory rate, is the rate decreasing or increasing over the first 3 years of life? Hint: Is the graph of the quadratic in the exponent opening upward or downward? Where is the vertex? c. Verify your answer to part b using a graphing calculator. d. For a 1- year-old infant in the 95 th percentile, how much higher is the walking respiratory rate then the sleeping respiratory rate? e. f.arrow_forwardDoes a linear, exponential, or logarithmic model best fit the data in Table 2? Find the model.arrow_forward
- It is believed that the electrical energy that a chemical plant consumes each month is related to the average environmental temperature, the number of days in the month, the average purity of the product, and the tons of product manufactured. Historical data is available for the previous year and is presented in the following table (seen in the image=. Perform simple linear regression analysisarrow_forwardDevelop a simple linear regression equation for starting salaries using an independent variable that has the closest relationship with the salaries. Explain how you chose this variable.arrow_forwardDevelop an estimated multiple regression equation that relates risk of a stroke to a person's age, systolic blood pressure and whether the person is a smoker. x1=persons age x2systrolic blood pressure x3=whether person is a smoker or non smokerarrow_forward
- A car dealer wants to estimate the price of a used car based on the age of the car and the mileage. Based on a sample of 20 cars, she determines the sample regression equation that predicts price taxes on the basis of the age (in years) of the number of miles is Price=21,619-1022Age-0.03 Miles (a) If the age of the car was fixed and the mileage was increased by 10,000, how much would the price increase or decrease and by how much? (b) Predict the selling price of a five-year-old car with 65,000 miles. (Round your answers to the nearest whole number.)arrow_forwardWhat is the equation of the regression linearrow_forward
arrow_back_ios
arrow_forward_ios
Recommended textbooks for you
 Calculus For The Life SciencesCalculusISBN:9780321964038Author:GREENWELL, Raymond N., RITCHEY, Nathan P., Lial, Margaret L.Publisher:Pearson Addison Wesley,
 Glencoe Algebra 1, Student Edition, 9780079039897...AlgebraISBN:9780079039897Author:CarterPublisher:McGraw Hill
 Algebra & Trigonometry with Analytic GeometryAlgebraISBN:9781133382119Author:SwokowskiPublisher:Cengage
 Algebra and Trigonometry (MindTap Course List)AlgebraISBN:9781305071742Author:James Stewart, Lothar Redlin, Saleem WatsonPublisher:Cengage Learning
 Trigonometry (MindTap Course List)TrigonometryISBN:9781305652224Author:Charles P. McKeague, Mark D. TurnerPublisher:Cengage Learning
Calculus For The Life Sciences
Calculus
ISBN:9780321964038
Author:GREENWELL, Raymond N., RITCHEY, Nathan P., Lial, Margaret L.
Publisher:Pearson Addison Wesley,
Glencoe Algebra 1, Student Edition, 9780079039897...
Algebra
ISBN:9780079039897
Author:Carter
Publisher:McGraw Hill
Algebra & Trigonometry with Analytic Geometry
Algebra
ISBN:9781133382119
Author:Swokowski
Publisher:Cengage
Algebra and Trigonometry (MindTap Course List)
Algebra
ISBN:9781305071742
Author:James Stewart, Lothar Redlin, Saleem Watson
Publisher:Cengage Learning
Trigonometry (MindTap Course List)
Trigonometry
ISBN:9781305652224
Author:Charles P. McKeague, Mark D. Turner
Publisher:Cengage Learning
Correlation Vs Regression: Difference Between them with definition & Comparison Chart; Author: Key Differences;https://www.youtube.com/watch?v=Ou2QGSJVd0U;License: Standard YouTube License, CC-BY
Correlation and Regression: Concepts with Illustrative examples; Author: LEARN & APPLY : Lean and Six Sigma;https://www.youtube.com/watch?v=xTpHD5WLuoA;License: Standard YouTube License, CC-BY