
Concept explainers
Videos
Recall that in exercise 45 the personnel director for Electronics Associates developed the following estimated regression equation relating an employee’s score on a job satisfaction test to length of service and wage rate.
where
x1 = length of service (years)
x2 = wage rate (dollars)
y = job satisfaction test score (higher scores indicate greater job satisfaction)
A portion of the Excel Regression tool output follows.
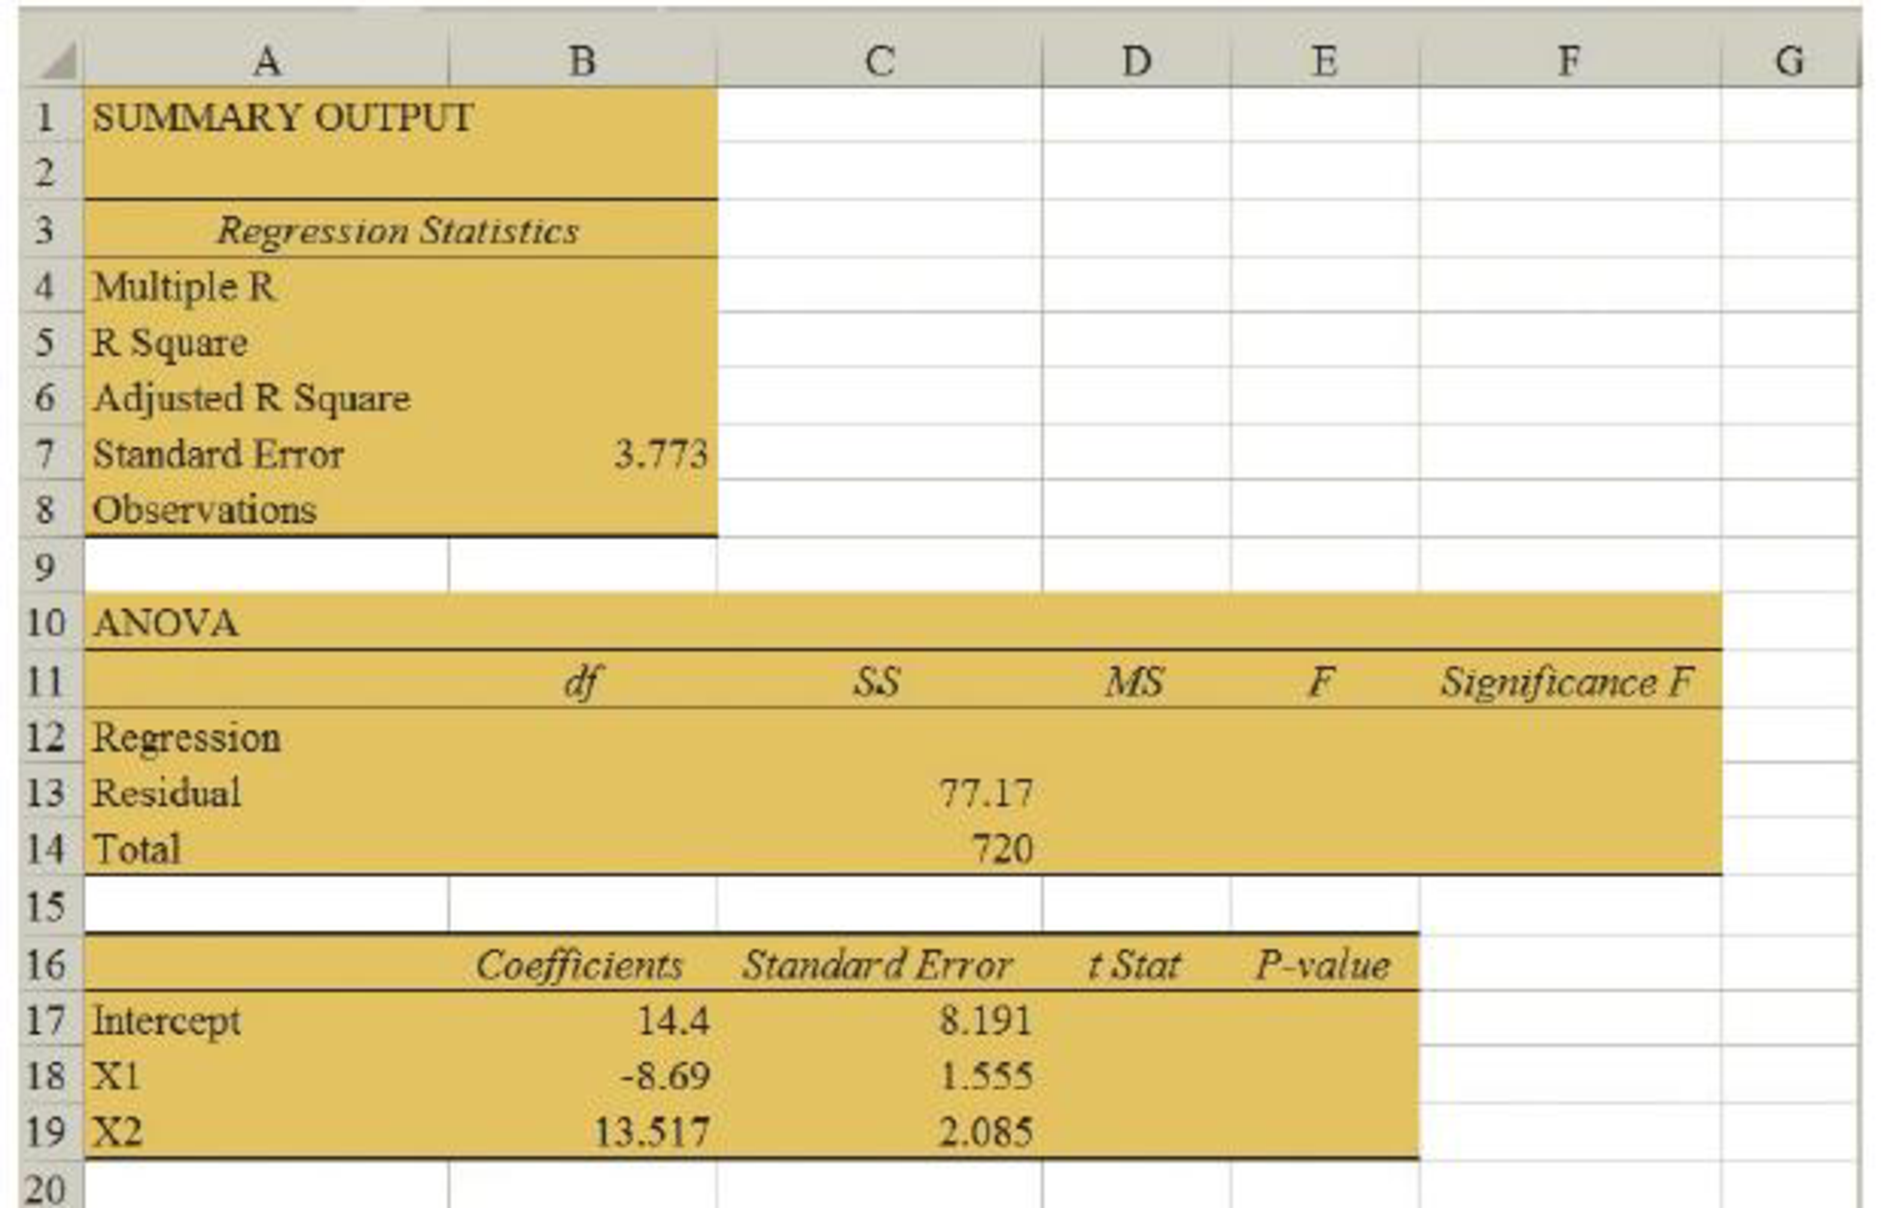
- a. Complete the missing entries in this output.
- b. Using α = .05, test for overall significance.
- c. Did the estimated regression equation provide a good fit to the data? Explain.
- d. Use the t test and α = .05 to test H0: β1 = 0 and H0: β2 = 0.
45. The personnel director for Electronics Associates developed the following estimated regression equation relating an employee’s score on a job satisfaction test to his or her length of service and wage rate.
where
x1 = length of service (years)
x2 = wage rate (dollars)
y = job satisfaction test score (higher scores indicate greater job satisfaction)
- a. Interpret the coefficients in this estimated regression equation.
- b. Predict the job satisfaction test score for an employee who has four years of service and makes $6.50 per hour.
Want to see the full answer?
Check out a sample textbook solution
Chapter 15 Solutions
Modern Business Statistics with Microsoft Office Excel (with XLSTAT Education Edition Printed Access Card)


- Find the equation of the regression line for the following data set. x 1 2 3 y 0 3 4arrow_forwardDoes Table 1 represent a linear function? If so, finda linear equation that models the data.arrow_forwardWhat does the y -intercept on the graph of a logistic equation correspond to for a population modeled by that equation?arrow_forward
- Olympic Pole Vault The graph in Figure 7 indicates that in recent years the winning Olympic men’s pole vault height has fallen below the value predicted by the regression line in Example 2. This might have occurred because when the pole vault was a new event there was much room for improvement in vaulters’ performances, whereas now even the best training can produce only incremental advances. Let’s see whether concentrating on more recent results gives a better predictor of future records. (a) Use the data in Table 2 (page 176) to complete the table of winning pole vault heights shown in the margin. (Note that we are using x=0 to correspond to the year 1972, where this restricted data set begins.) (b) Find the regression line for the data in part ‚(a). (c) Plot the data and the regression line on the same axes. Does the regression line seem to provide a good model for the data? (d) What does the regression line predict as the winning pole vault height for the 2012 Olympics? Compare this predicted value to the actual 2012 winning height of 5.97 m, as described on page 177. Has this new regression line provided a better prediction than the line in Example 2?arrow_forwardFind the mean hourly cost when the cell phone described above is used for 240 minutes.arrow_forwardTable 2 shows a recent graduate’s credit card balance each month after graduation. a. Use exponential regression to fit a model to these data. b. If spending continues at this rate, what will the graduate’s credit card debt be one year after graduating?arrow_forward
- make a regression analysis about any healthcare issuearrow_forwardFor a particular red wine, the auction selling price for a 750-milliliter bottle and the age of the wine (in years) was recorded and used to regress the Auction Selling Price (the y-variable) on the Age (the x-variable). The Excel regression analysis showed that the estimated regression equation was: y with hat on top equals 9.02 plus 6.95 x Use this estimated regression equation to predict the Auction Selling Price of a 750-milliliter bottle of this red wine that is 15 years old. Give the EXACT value. The predicted Auction Selling Price of a 750-milliliter bottle of this red wine that is 15 years old is $arrow_forwardMake a sample data about the factors that could be rated to the number of text/chat messages a senior high student/s sends in a day. Make a scenario out of it using the data needed in correlation and regression analysis. Use samples that are less than 30. Lastly, test your claim if it is true and form the regression equation for this scenario.arrow_forward
- The following table gives the data for the average temperature and the snow accumulation in several small towns for a single month. Determine the equation of the regression line, yˆ=b0+b1xy^=b0+b1x. Round the slope and y-intercept to the nearest thousandth. Then determine if the regression equation is appropriate for making predictions at the 0.010.01 level of significance. Average Temperatures and Snow Accumulations Average Temperature (℉℉) 38 30 17 39 45 22 34 24 29 38 Snow Accumulation (in.in.) 6 19 27 5 13 26 26 14 13 5 Copy Dataarrow_forwardDiscuss how the autocorrelation would affect the regression estimates in the regression analysis.arrow_forwardA car dealer wants to estimate the price of a used car based on the age of the car and the mileage. Based on a sample of 20 cars, she determines the sample regression equation that predicts price taxes on the basis of the age (in years) of the number of miles is Price=21,619-1022Age-0.03 Miles (a) If the age of the car was fixed and the mileage was increased by 10,000, how much would the price increase or decrease and by how much? (b) Predict the selling price of a five-year-old car with 65,000 miles. (Round your answers to the nearest whole number.)arrow_forward
 College AlgebraAlgebraISBN:9781305115545Author:James Stewart, Lothar Redlin, Saleem WatsonPublisher:Cengage Learning
 Algebra & Trigonometry with Analytic GeometryAlgebraISBN:9781133382119Author:SwokowskiPublisher:Cengage
 Algebra and Trigonometry (MindTap Course List)AlgebraISBN:9781305071742Author:James Stewart, Lothar Redlin, Saleem WatsonPublisher:Cengage Learning
 Glencoe Algebra 1, Student Edition, 9780079039897...AlgebraISBN:9780079039897Author:CarterPublisher:McGraw Hill
 College Algebra (MindTap Course List)AlgebraISBN:9781305652231Author:R. David Gustafson, Jeff HughesPublisher:Cengage Learning