Videos
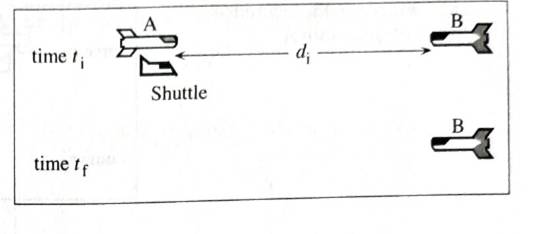
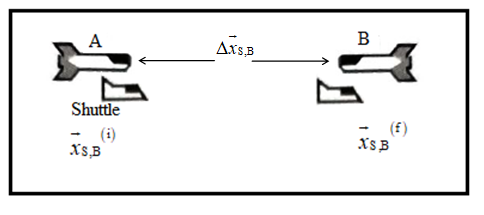
The second diagram at right shows the positions of spaceships A, B, and the shuttle at time ti in the reference frame of spaceship B.
Sketch spaceship A and the shuttle at their positions at time tf as measured in the reference frame of spaceship B.
Explain how the diagram is consistent with the fact that in its own frame of reference, spaceship B is not moving.
Diagram for refrence frame of spaceship B
In the box at right, draw and label vectors for the following quantities:
→x(i)S→x(f)S, and Δ→xS in frame of spaceship B
•
→xS,B(i) (the initial position of the shuttle in the frame of spaceship B)
•
→xS,B(f) (the final position of the shuttle in the frame of spaceship B)
•
→xS,B (the displacement, or change in position, of the shuttle in the frame of spaceship B).
Is the quantity →xS,B associated with:
• a single instant in time or an interval of time? Explain.
• the distance between two objects or the distance traveled by a single object? Explain.
Describe how you could use Δ→xS,B , to determine the velocity of the shuttle in the frame of spaceship B.
To Draw: Spaceship A and the shuttle at their positions at time tf in the reference frame of spaceship B.
The vectors of the following quantities in frame of spaceship B →xS,B(i) , →xS,B(f) and Δ→xS,B . The association of quantity change in position ( Δ→xS,B ) with time and distance.
To Explain:Whether the diagram is consistent with the fact that in its own frame of reference spaceship B is not moving.
The use of Δ→xS,B in finding the velocity of the shuttle in the frame of spaceship B.
Answer to Problem 1aT
The diagram is consistent with the fact that in its own frame of reference spaceship B is not moving. The quantity Δ→xS,B is associated with interval of time and it represents distance travelled by single object.
Explanation of Solution
Introduction:
Spaceship A and B are moving towards each other and spaceship A releases the shuttle at time ti . Spaceship A, B and the shuttle at time ti is given.
Spaceship A and the shuttle at their positions at time tf as measured in the reference frame of spaceship B is represented in the diagram given below.
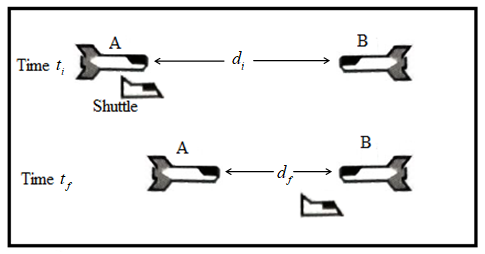
The diagram is consistent with the fact that in its own frame of reference spaceship B is not moving as the body appears to be at rest with its own frame of reference.
Diagram having following quantities →xS,B(i) , →xS,B(f) and Δ→xS,B in frame of spaceship B is drawn below.
Here, →xS,B(i) is the initial position of the shuttle in the frame of spaceship B, →xS,B(f) is the final position of the shuttle in the frame of spaceship B and Δ→xS,B is the displacement or change in position of the shuttle in the frame of spaceship B.
The quantity Δ→xS,B is associated with interval of time and it represents distance travelled by single object. It can be used to find velocity of shuttle in the frame of spaceship B using the expression given below.
→v=Δ→xS,Btf−ti
Here, tf is the final position of the shuttle and ti is the initial position of the shuttle.
Conclusion:
Thus, the diagram is consistent with the fact that in its own frame of reference spaceship B is not moving. The quantity Δ→xS,B is associated with interval of time and it represents distance travelled by single object.
Want to see more full solutions like this?
Chapter 1 Solutions
Tutorials in Introductory Physics
Additional Science Textbook Solutions
Cosmic Perspective Fundamentals
Concepts of Genetics (12th Edition)
College Physics: A Strategic Approach (3rd Edition)
Laboratory Experiments in Microbiology (12th Edition) (What's New in Microbiology)
Applications and Investigations in Earth Science (9th Edition)
Anatomy & Physiology (6th Edition)


- Portfolio Problem 2. A particle of mass m slides in a straight line (say along i) on a surface, with initial position x ©0 and initial velocity Vo > 0 at t = 0. The = particle is subject to a constant force F = -mai, with a > 0. While sliding on the surface, the particle is also subject to a friction force v Ff = -m fo = −m fov, with fo > 0, i.e., the friction force has constant magnitude mfo and is always opposed to the motion. We also assume fo 0, and solve it to find v(t) and x(t). How long does it take for the particle to come to a stop? How far does it travel? (b) After coming to a stop, the particle starts sliding backwards with negative velocity. Write the equation of motion in this case, and solve it to find the time at which the particle returns to the original position, x = 0. Show that the final speed at x 0 is smaller than Vo. = Express all your answers in terms of a, fo and Vo.arrow_forward= Portfolio Problem 1. A particle of mass m is dropped (i.e., falls down with zero initial velocity) at time t 0 from height h. If the particle is subject to gravitational acceleration only, i.e., a = −gk, determine its speed as it hits the ground by solving explicitly the expressions for its velocity and position. Next, verify your result using dimensional analysis, assuming that the general relation is of the form v = khag³m, where k is a dimensionless constant.arrow_forwardReview Conceptual Example 2 before attempting this problem. Two slits are 0.158 mm apart. A mixture of red light (wavelength = 693 nm) and yellow-green light (wavelength = 567 nm) falls on the slits. A flat observation screen is located 2.42 m away. What is the distance on the screen between the third-order red fringe and the third-order yellow- green fringe? m = 3 m = 3 m= 0 m = 3 m = 3 Fringes on observation screenarrow_forward
- In the figure below, a semicircular conductor of radius R = 0.260 m is rotated about the axis AC at a constant rate of 130 rev/min. A uniform magnetic field of magnitude 1.22 T fills the entire region below the axis and is directed out of the page. In this illustration, a wire extends straight to the right from point A, then curves up and around in a semicircle of radius R. On the right side of the semicircle, the wire continues straight to the right to point C. The wire lies in the plane of the page, in a region of no magnetic field. Directly below the axis A C is a region of uniform magnetic field pointing out of the page, vector Bout. If viewed from the right, the wire can rotate counterclockwise, so that the semicircular part can rotate into the region of magnetic field. (a) Calculate the maximum value of the emf induced between the ends of the conductor. V(b) What is the value of the average induced emf for each complete rotation? Consider carefully whether the correct answer is…arrow_forwardA coil of 15 turns and radius 10.0 cm surrounds a long solenoid of radius 2.20 cm and 1.00 103 turns/meter (see figure below). The current in the solenoid changes as I = 6.00 sin(120t), where I is in amperes and t is in seconds. Find the induced emf (in volts) in the 15-turn coil as a function of time. (Do not include units in your answer.) =arrow_forwardA coil of 15 turns and radius 10.0 cm surrounds a long solenoid of radius 1.80 cm and 1.00 103 turns/meter (see figure below). The current in the solenoid changes as I = 5.00 sin(120t), where I is in amperes and t is in seconds. Find the induced emf (in volts) in the 15-turn coil as a function of time. (Do not include units in your answer.) =arrow_forward
- Which vowel does this graph represent (”ah,” “ee,” or “oo”)? How can you tell? Also, how would you be able to tell for the other vowels?arrow_forwardConcept Simulation 26.4 provides the option of exploring the ray diagram that applies to this problem. The distance between an object and its image formed by a diverging lens is 5.90 cm. The focal length of the lens is -2.60 cm. Find (a) the image distance and (b) the object distance.arrow_forwardA bat is flying toward a cave wall at 27.0 m/s. What is the frequency of the reflected sound that it hears, assuming it emits sound at 52.0 kHz? The speed of sound is 341.5 m/s. Multiple Choice о 60.9 kHz О 56.5 kHz о 61.3 kHz О 56.1 kHzarrow_forward
- Compare the slope of your Data Table 2 graph to the average wavelength (Ave, l) from Data Table 2 by calculating the % Difference. Is the % Difference calculated for the wavelength in Data Table 2 within an acceptable % error? Explain why or why not?arrow_forwardThe slope of a graph of velocity, v, vs frequency, f, is equal to wavelength, l. Compare the slope of your Data Table 1 graph to the average wavelength (Ave, l) from Data Table 1 by calculating the % Difference.arrow_forwardExamine the slope of the line on the graph created using the data in Data Table 4 of Period, T2 vs L, the slope of the line is a constant containing the acceleration due to gravity, g. Using the slope of your line, determine the experimental value for g. Compare the value you determined for g from the slope of the graph to the expected value of 9.81 m/s2 by calculating the percent error.arrow_forward
 University Physics Volume 3PhysicsISBN:9781938168185Author:William Moebs, Jeff SannyPublisher:OpenStax
 Physics for Scientists and Engineers: Foundations...PhysicsISBN:9781133939146Author:Katz, Debora M.Publisher:Cengage Learning
 Glencoe Physics: Principles and Problems, Student...PhysicsISBN:9780078807213Author:Paul W. ZitzewitzPublisher:Glencoe/McGraw-Hill
 Modern PhysicsPhysicsISBN:9781111794378Author:Raymond A. Serway, Clement J. Moses, Curt A. MoyerPublisher:Cengage Learning
 College PhysicsPhysicsISBN:9781305952300Author:Raymond A. Serway, Chris VuillePublisher:Cengage Learning
 College PhysicsPhysicsISBN:9781285737027Author:Raymond A. Serway, Chris VuillePublisher:Cengage Learning