
Videos
To find:the data present sufficient efficient to indicate a difference in brightness measurements for two process. Use both parametric and non-parametric test and compare the results
Answer to Problem 15.59SE
Non-parametric:There is sufficient evidence to support the claim that there is a difference in the brightness measurements for the two process.
Parametric: There is not sufficient evidence to support the claim that there is a difference in the brightness measurements for the two process.
Explanation of Solution
Given:
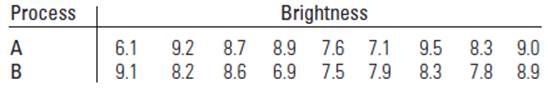
The coded values for measures of brightness in paper, prepared by two different process, are given in the table.
Calculation:
The null hypothesis states that there is no difference in the populations. The alternatives hypothesis states the opposite of the null hypothesis.
Determine the difference in the data in the data values of each pair and determine the sign of the difference. The smallest value receives the rank 1, the second smallest value receives the rank 2, the third smallest value receives the rank 3 and so on.
If the multiple data value has the same, then their rank is the average of the corresponding rank.
Now, to determine the difference in the ranks.
| First sample | Rank | Second sample | Rank |
| 6.1 | 1 | 6.9 | 2 |
| 7.1 | 3 | 7.5 | 4 |
| 7.6 | 5 | 7.8 | 6 |
| 8.3 | 9.5 | 7.9 | 7 |
| 8.7 | 12 | 8.2 | 8 |
| 8.9 | 13.5 | 8.3 | 9.5 |
| 9 | 15 | 8.6 | 11 |
| 9.2 | 17 | 8.9 | 13.5 |
| 9.5 | 18 | 9.1 | 16 |
When the test is left-tailed,
Next, it is determining the value of
The value of the test statistics is equal to min
The critical value of the Wilcoxon signed is given in the row
The rejection region contains all values smaller than or equal to
If the value of the test statistics is in the rejection region, then it rejects the null hypothesis
There issufficient evidence to support the claim that there is a difference in the brightness measurements for the two process.
Descriptive measures:
The mean is the sum of all values divided by the number of values:
Now, let us determine the squares of the difference of the rank
The sample variance is the sum of the squared deviation from the mean divided by
It is noted that neither of the variance is more than the other variance (as the same is true for the sample standard deviations) thus it is then appropriate to use the pooled test.
Parametric test (pooled
Given claim: The means differ
The claim is either null hypothesis or the alternatives hypothesis. The null hypothesis or the alternatives hypothesis states that these are opposite to each other. The null hypothesis needs to contain an equality.
Now, let us determine the pooled standard deviation:
Determine the test statistic:
The
If the
There is not sufficient evidence to support the claim that there is a difference in the brightness measurements for the two process.
Hence, it is concluded that both Parametric and Non-parametric:
Non-parametric: There is sufficient evidence to support the claim that there is a difference in the brightness measurements for the two process.
Parametric: There is not sufficient evidence to support the claim that there is a difference in the brightness measurements for the two process.
Want to see more full solutions like this?
Chapter 15 Solutions
EP INTRODUCTION TO PROBABILITY+STAT.


 Big Ideas Math A Bridge To Success Algebra 1: Stu...AlgebraISBN:9781680331141Author:HOUGHTON MIFFLIN HARCOURTPublisher:Houghton Mifflin Harcourt
 Glencoe Algebra 1, Student Edition, 9780079039897...AlgebraISBN:9780079039897Author:CarterPublisher:McGraw Hill
 Holt Mcdougal Larson Pre-algebra: Student Edition...AlgebraISBN:9780547587776Author:HOLT MCDOUGALPublisher:HOLT MCDOUGAL
 Algebra & Trigonometry with Analytic GeometryAlgebraISBN:9781133382119Author:SwokowskiPublisher:Cengage