
Concept explainers
Videos
Significance of Racing Bike Weight on Price. In exercise 20, data on x = weight (pounds) and y = price ($) for 10 road-racing bikes provided the estimated regression equation
20. Price and Weight of Bicycles. Bicycling, the world’s leading cycling magazine, reviews hundreds of bicycles throughout the year. Their “Road-Race” category contains reviews of bikes used by riders primarily interested in racing. One of the most important factors in selecting a bike for racing is the weight of the bike. The following data show the weight (pounds) and price ($) for 10 racing bikes reviewed by the magazine (Bicycling website).
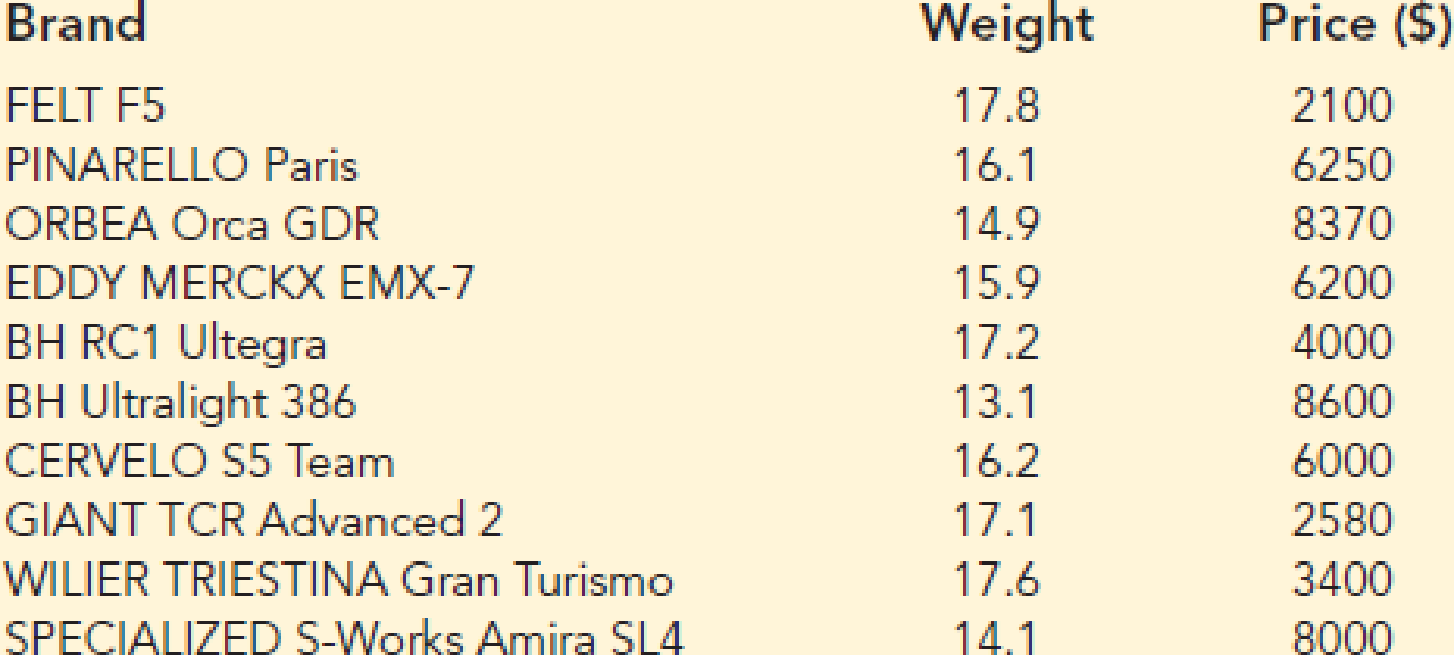
- a. Use the data to develop an estimated regression equation that could be used to estimate the price for a bike given the weight.
- b. Compute r2. Did the estimated regression equation provide a good fit?
- c. Predict the price for a bike that weighs 15 pounds.
Want to see the full answer?
Check out a sample textbook solution
Chapter 14 Solutions
Mindtapv2.0 For Anderson/sweeney/williams/camm/cochran's Modern Business Statistics With Microsoft Excel, 1 Term Printed Access Card (mindtap Course List)


- What is the regression equation? Find the best predicted weight of a bear with the chest size of 53 inches. arrow_forwardInterpret an R^2 value of 0.62 for a linear regression model where X is the independent variable and Y is the dependent variable.arrow_forwardYou are attempting to predict grade point average based on the amount a student drinks. You calculate a simple regression and get a slope coefficient (b) of -.15. What does this slope coefficient mean?arrow_forward
- Write out the regression equation based on the output. What happens to exam performance with every increase in exam anxiety and what do you notice about the standardized regression coefficient (Beta) and the correlation?arrow_forwardWould the regression in Equation be useful for predicting test scoresin a school district in Massachusetts? Why or why not?arrow_forwardDescribe about how to place a regression line?arrow_forward
- The following table gives the data for the average temperature and the snow accumulation in several small towns for a single month. Determine the equation of the regression line, yˆ=b0+b1xy^=b0+b1x. Round the slope and y-intercept to the nearest thousandth. Then determine if the regression equation is appropriate for making predictions at the 0.01 level of significance. Average Temperatures and Snow Accumulations Average Temperature (℉℉) 45 34 24 45 39 20 31 19 35 44 Snow Accumulation (in.in.) 9 16 24 9 15 28 25 18 16 5 1. Regression equation: y=__________ 2. Is the equation appropriate? yes or noarrow_forwardAriel was running analyses over and over in census data and came across a correlation between weight and debt (r=.78). Independent variable is weight and dependent variable is debt. b) Curious Ariel noted some statistics on these weight (M=160lb, SD=15lb) and debt (M=196k, SD=20k). If Ariel wanted to calculate a regression equation, what would her slope and intercept be?arrow_forwardA microcomputer manufacturer has developed a regression model relating his sales (y=$10,000s) with three independent variables. The three independent variables are price per unit(Price in $100s), advertising( ADV in $1000s) and the number of product lines (Lines). Part of the regression results is shown below. Coefficient Standard Error Intercept 1.0211 22.8752 Price(X1) -0.1524 0.1411 ADV (X2) 0.8849 0.2886 Lines(X3) -0.1463 1.5340 Source d.f. S.S. Regression 3 2708.61 Error 14 2840.51 Total 17 5549.12 What has been the sample size (n) for this analysis? Use the above results to find the estimated multiple…arrow_forward
- For a group of children, mean age is 10 years with S.D. 2·5 years. The average height of the group is 125 cms with S.D. of 13 cms. The coefficient of correlation between age and height is 0-6. Write the equation of two regression lines and explain their use.arrow_forwardThe average number of passing yards per attempt for the New York Jets during the 2011 season was 6.5, and the team’s number of interceptions thrown per attempt was 0.033. Use the estimated regression equation developed in part (c) to predict the percentage of games won by the New York Jets during the 2011 season. (Note: For the 2011 the 2011 season, the New York Jets' record was 7 wins and 9 loses.arrow_forwardplease use this situation: A small theater company has a linear regression model to estimate y = the concession stand sales in dollars, based on knowing x = the number of people in attendance. The regression equation is: = 6.72x + 11.50 and the correlation coefficient was r = 0.781. The data set saw the number of people in attendance ranging from a minimum of 18 people to a maximum of 170 people. 1) Interpret the slope of the regression equation in the context of the problem. If it would make sense, interpret the y-intercept and if it doesn’t make sense to do that say why.arrow_forward
 Glencoe Algebra 1, Student Edition, 9780079039897...AlgebraISBN:9780079039897Author:CarterPublisher:McGraw Hill
 Big Ideas Math A Bridge To Success Algebra 1: Stu...AlgebraISBN:9781680331141Author:HOUGHTON MIFFLIN HARCOURTPublisher:Houghton Mifflin Harcourt