
Statistics: The Art and Science of Learning from Data (4th Edition)
4th Edition
ISBN: 9780321997838
Author: Alan Agresti, Christine A. Franklin, Bernhard Klingenberg
Publisher: PEARSON
expand_more
expand_more
format_list_bulleted
Concept explainers
Videos
Textbook Question
Chapter 14.3, Problem 35PB
Regression of weight gain on diet Refer to the previous exercise.
- a. Set up indicator variables for protein source and for protein level and specify a regression model with the effects both of protein level and protein source on weight gain.
- b. Fit the model in part a and explain how to interpret the parameter estimate for the protein level indicator variable.
- c. Show how you could test a hypothesis about beta parameters in the model in part a to analyze the effect of protein source on weight gain.
- d. Using the fit of the model, find the estimated
mean for each of the six diets. Explain what it means when we say that these estimated means do not allow for interaction between protein level and source in their effects on weight loss.
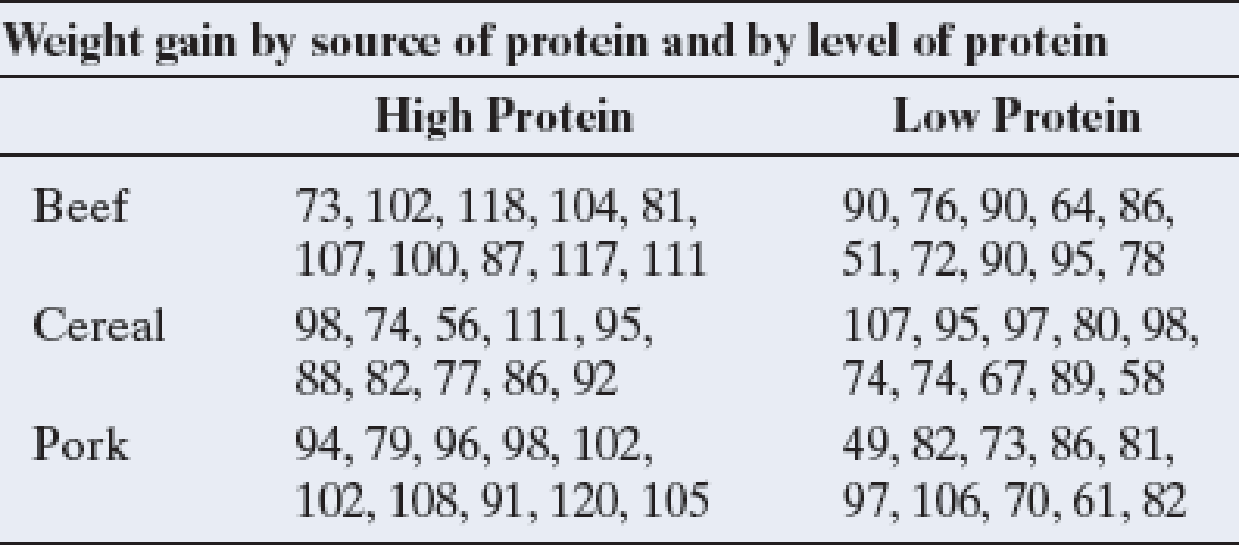
14.34 Diet and weight gain A randomized experiment4 measured weight gain (in grams) of male rats under six diets varying by source of protein (beef, cereal, pork) and level of protein (high, low). Ten rats were assigned to each diet. The data are shown in the table that follows and are also available in the Protein and Weight Gain data file on the book’s website.
- a. Conduct a two-way ANOVA that assumes a lack of interaction. Report the F test statistic and the P-value for testing the effect of the protein level. Interpret.
- b. Now conduct a two-way ANOVA that also considers potential interaction. Report the hypotheses, test statistic, and P-value for a test of no interaction. What do you conclude at the 0.05 significance level? Explain.
- c. Refer to part b. Allowing interaction, construct a 95% confidence interval to compare the mean weight gain for the two protein levels, for the beef source of protein.
Expert Solution & Answer
Want to see the full answer?
Check out a sample textbook solution
Chapter 14 Solutions
Statistics: The Art and Science of Learning from Data (4th Edition)
Ch. 14.1 - Hotel satisfaction The CEO of a company that owns...Ch. 14.1 - Prob. 2PBCh. 14.1 - Whats the best way to learn French? The following...Ch. 14.1 - Prob. 4PBCh. 14.1 - Prob. 5PBCh. 14.1 - ANOVA and box plots For two studies, each...Ch. 14.1 - Prob. 7PBCh. 14.1 - Smoking and personality A study about smoking and...Ch. 14.1 - Prob. 9PBCh. 14.1 - Prob. 10PB
Ch. 14.1 - Prob. 11PBCh. 14.2 - House prices and age For the House Selling Prices...Ch. 14.2 - Time on Facebook Do freshmen spent significantly...Ch. 14.2 - Prob. 14PBCh. 14.2 - Tukey holding time comparisons Refer to the...Ch. 14.2 - Prob. 16PBCh. 14.2 - REM regression Refer to the previous exercise. a....Ch. 14.2 - Prob. 18PBCh. 14.2 - Regression for outsourcing Refer to the previous...Ch. 14.2 - Advertising effect oil sales Each of 100...Ch. 14.3 - Reducing cholesterol An experiment randomly...Ch. 14.3 - Prob. 24PBCh. 14.3 - Political ideology in 2014 The GSS measures...Ch. 14.3 - Prob. 26PBCh. 14.3 - Corn and manure In Example 10, the coefficient of...Ch. 14.3 - Prob. 28PBCh. 14.3 - Regression for telephone holding times Refer to...Ch. 14.3 - Prob. 30PBCh. 14.3 - Income by gender and degree In 2012, the...Ch. 14.3 - Prob. 32PBCh. 14.3 - Attractiveness and getting dates The results in...Ch. 14.3 - Prob. 34PBCh. 14.3 - Regression of weight gain on diet Refer to the...Ch. 14 - Good friends and marital status Is the number of...Ch. 14 - Prob. 37CPCh. 14 - Singles watch more TV The 2014 General Social...Ch. 14 - Prob. 39CPCh. 14 - Prob. 40CPCh. 14 - Prob. 41CPCh. 14 - Prob. 42CPCh. 14 - Prob. 43CPCh. 14 - Comparing therapies for anorexia The Anorexia data...Ch. 14 - Prob. 45CPCh. 14 - Prob. 46CPCh. 14 - Prob. 47CPCh. 14 - Prob. 48CPCh. 14 - Prob. 49CPCh. 14 - Prob. 50CPCh. 14 - Prob. 51CPCh. 14 - TV watching by gender and race When we use the...Ch. 14 - Prob. 53CPCh. 14 - Prob. 54CPCh. 14 - Prob. 55CPCh. 14 - Prob. 56CPCh. 14 - Prob. 57CPCh. 14 - Prob. 59CPCh. 14 - Prob. 60CPCh. 14 - Prob. 61CPCh. 14 - Prob. 62CPCh. 14 - Prob. 63CPCh. 14 - Prob. 64CPCh. 14 - Prob. 65CPCh. 14 - Prob. 66CPCh. 14 - Prob. 67CPCh. 14 - Prob. 68CPCh. 14 - Prob. 69CPCh. 14 - Prob. 70CPCh. 14 - Prob. 71CP
Knowledge Booster


Learn more about
Need a deep-dive on the concept behind this application? Look no further. Learn more about this topic, statistics and related others by exploring similar questions and additional content below.Similar questions
- Life Expectancy The following table shows the average life expectancy, in years, of a child born in the given year42 Life expectancy 2005 77.6 2007 78.1 2009 78.5 2011 78.7 2013 78.8 a. Find the equation of the regression line, and explain the meaning of its slope. b. Plot the data points and the regression line. c. Explain in practical terms the meaning of the slope of the regression line. d. Based on the trend of the regression line, what do you predict as the life expectancy of a child born in 2019? e. Based on the trend of the regression line, what do you predict as the life expectancy of a child born in 1580?2300arrow_forwardFind the equation of the regression line for the following data set. x 1 2 3 y 0 3 4arrow_forward
Recommended textbooks for you
 Functions and Change: A Modeling Approach to Coll...AlgebraISBN:9781337111348Author:Bruce Crauder, Benny Evans, Alan NoellPublisher:Cengage Learning
 Calculus For The Life SciencesCalculusISBN:9780321964038Author:GREENWELL, Raymond N., RITCHEY, Nathan P., Lial, Margaret L.Publisher:Pearson Addison Wesley,
 Algebra and Trigonometry (MindTap Course List)AlgebraISBN:9781305071742Author:James Stewart, Lothar Redlin, Saleem WatsonPublisher:Cengage Learning
 Glencoe Algebra 1, Student Edition, 9780079039897...AlgebraISBN:9780079039897Author:CarterPublisher:McGraw Hill
 Algebra & Trigonometry with Analytic GeometryAlgebraISBN:9781133382119Author:SwokowskiPublisher:Cengage
Functions and Change: A Modeling Approach to Coll...
Algebra
ISBN:9781337111348
Author:Bruce Crauder, Benny Evans, Alan Noell
Publisher:Cengage Learning
Calculus For The Life Sciences
Calculus
ISBN:9780321964038
Author:GREENWELL, Raymond N., RITCHEY, Nathan P., Lial, Margaret L.
Publisher:Pearson Addison Wesley,
Algebra and Trigonometry (MindTap Course List)
Algebra
ISBN:9781305071742
Author:James Stewart, Lothar Redlin, Saleem Watson
Publisher:Cengage Learning
Glencoe Algebra 1, Student Edition, 9780079039897...
Algebra
ISBN:9780079039897
Author:Carter
Publisher:McGraw Hill
Algebra & Trigonometry with Analytic Geometry
Algebra
ISBN:9781133382119
Author:Swokowski
Publisher:Cengage
Correlation Vs Regression: Difference Between them with definition & Comparison Chart; Author: Key Differences;https://www.youtube.com/watch?v=Ou2QGSJVd0U;License: Standard YouTube License, CC-BY
Correlation and Regression: Concepts with Illustrative examples; Author: LEARN & APPLY : Lean and Six Sigma;https://www.youtube.com/watch?v=xTpHD5WLuoA;License: Standard YouTube License, CC-BY