
Introductory Statistics (10th Edition)
10th Edition
ISBN: 9780321989178
Author: Neil A. Weiss
Publisher: PEARSON
expand_more
expand_more
format_list_bulleted
Concept explainers
Videos
Textbook Question
Chapter 14.2, Problem 42E
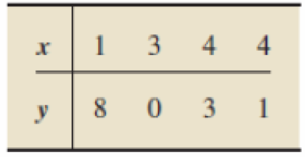
In each of Exercises 14.42–14.45, we have presented two linear equations and a set of data points. For each exercise,
- a. plot the data points and the first linear equation on one graph and the data points and the second linear equation on another.
- b. construct tables for x, y, ŷ, e, and e2 like Table 14.4 (page 626).
- c. determine which line fits the set of data points better, according to the least-squares criterion.
14.42 Line A: y = 9 - 2x, Line B: y = 6 - x
Data points:
Expert Solution & Answer
Want to see the full answer?
Check out a sample textbook solution
Students have asked these similar questions
Exercises 83–86: The table lists data that are exactly linear.
a. Find the slope-intercept form of the line that passes through these
data points.
b. Predict y when x = -2.7 and 6.3. Decide if these calculations
involve interpolation or extrapolation.
-3
-2
-1
1
83.
y
-7.7
-6.2
-4.7
-3.2
-1.7
In Exercises 5–20, find the equation of each of the lines with the given
properties. Sketch the graph of each line.
Exercises 27–36 tell how many units and in what directions the graphs of the given equations are to be shifted. Give an equation for the shifted graph. Then sketch the original and shifted graphs together, labeling each graph with its equation.
Chapter 14 Solutions
Introductory Statistics (10th Edition)
Ch. 14.1 - Regarding linear equations with one independent...Ch. 14.1 - Prob. 2ECh. 14.1 - Consider the linear equation y = b0 + b1x. a....Ch. 14.1 - Prob. 4ECh. 14.1 - In Exercises 14.514.14, we give linear equations....Ch. 14.1 - Prob. 6ECh. 14.1 - In Exercises 14.5-14.14, we give linear equations....Ch. 14.1 - Prob. 8ECh. 14.1 - Prob. 9ECh. 14.1 - In Exercises 14.514.14, we give linear equations....
Ch. 14.1 - Prob. 11ECh. 14.1 - Prob. 12ECh. 14.1 - Prob. 13ECh. 14.1 - Prob. 14ECh. 14.1 - In Exercises 14.1514.22,we identify the...Ch. 14.1 - Prob. 16ECh. 14.1 - Prob. 17ECh. 14.1 - Prob. 18ECh. 14.1 - Prob. 19ECh. 14.1 - Prob. 20ECh. 14.1 - Prob. 21ECh. 14.1 - Prob. 22ECh. 14.1 - Rental-Car Costs. During one month, the Avis...Ch. 14.1 - Air-Conditioning Repairs. Richards Healing and...Ch. 14.1 - Measuring Temperature. The two most commonly used...Ch. 14.1 - A Law of Physics. A ball is thrown straight up in...Ch. 14.1 - Prob. 27ECh. 14.1 - Prob. 28ECh. 14.1 - Prob. 29ECh. 14.1 - Prob. 30ECh. 14.1 - Prob. 31ECh. 14.1 - Road Grade. The grade of a road is defined as the...Ch. 14.1 - Vertical Lines. In this section, we stated that...Ch. 14.2 - Regarding a scatterplot, a. identify one of its...Ch. 14.2 - Regarding the criterion used to decide on the line...Ch. 14.2 - Regarding the line that best fits a set of data...Ch. 14.2 - Regarding the two variables under consideration in...Ch. 14.2 - Using the regression equation to make predictions...Ch. 14.2 - Fill in the blanks. a. In the context of...Ch. 14.2 - For which of the following sets of data points can...Ch. 14.2 - For which of the following sets of data points can...Ch. 14.2 - In each of Exercises 14.4214.45, we have presented...Ch. 14.2 - In each of Exercises 14.4214.45, we have presented...Ch. 14.2 - In each of Exercises 14.4214.45, we have presented...Ch. 14.2 - In each of Exercises 14.4214.45, we have presented...Ch. 14.2 - For a data set consisting of two data points: a....Ch. 14.2 - Prob. 47ECh. 14.2 - In each of Exercises 14.4814.57, a. find the...Ch. 14.2 - In each of Exercises 14.4814.57. a. find the...Ch. 14.2 - In each of Exercises 14.4814.57, a. find the...Ch. 14.2 - In each of Exercises 14.48-14.57, a. find the...Ch. 14.2 - In each of Exercises 14.4814.57, a. find the...Ch. 14.2 - In each of Exercises 14.4814.57, a. find the...Ch. 14.2 - In each of Exercises 14.48-14.57, a. find the...Ch. 14.2 - In each of Exercises 14.4814.57. a. find the...Ch. 14.2 - In each of Exercises 14.4814.57. a. find the...Ch. 14.2 - In each of Exercises 14.4814.57. a. find the...Ch. 14.2 - Prob. 58ECh. 14.2 - In each of Exercises 14.5814.63, a. find the...Ch. 14.2 - In each of Exercises 14.5814.63. a. find the...Ch. 14.2 - In each of Exercises 14.5814.63, a. find the...Ch. 14.2 - In each of Exercises 14.5814.63. a. find the...Ch. 14.2 - In each of Exercises 14.5814.63, a. find the...Ch. 14.2 - Tax Efficiency. In Exercise 14.58, you determined...Ch. 14.2 - Corvette Prices. In Exercise 14.59, you determined...Ch. 14.2 - Anscombes Quartet. In the article Graphs in...Ch. 14.2 - Study Time and Score. The negative relation...Ch. 14.2 - Age and Price of Orions. In Table 14.2, we...Ch. 14.2 - Wasp Mating Systems. In the paper "Mating System...Ch. 14.2 - In Exercises 14.7014.80, use the technology of...Ch. 14.2 - In Exercises 14.7014.80, use the technology of...Ch. 14.2 - In Exercises 14.7014.80, use the technology of...Ch. 14.2 - In Exercises I4.7014.80, use the technology of...Ch. 14.2 - In Exercises 14.7014.80, use the technology of...Ch. 14.2 - In Exercises 14.7014.80, use the technology of...Ch. 14.2 - Prob. 76ECh. 14.2 - Prob. 77ECh. 14.2 - Prob. 78ECh. 14.2 - Prob. 79ECh. 14.2 - In Exercises 14.7014.80, use the technology of...Ch. 14.2 - Prob. 81ECh. 14.2 - Time Series. A collection of observations of a...Ch. 14.3 - In this section, we introduced a descriptive...Ch. 14.3 - A measure of total variation in the observed...Ch. 14.3 - A measure of the amount of variation in the...Ch. 14.3 - A measure of the amount of variation in the...Ch. 14.3 - Prob. 87ECh. 14.3 - In Exercises 14.8814.97, we repeal the data and...Ch. 14.3 - In Exercises14.481497, we repeal the tiara and...Ch. 14.3 - In Exercises 14.8814.97, we repeat the data and...Ch. 14.3 - Prob. 91ECh. 14.3 - Prob. 92ECh. 14.3 - Prob. 93ECh. 14.3 - Prob. 94ECh. 14.3 - Prob. 95ECh. 14.3 - Prob. 96ECh. 14.3 - Prob. 97ECh. 14.3 - Applying the Concepts and Skills For Exercises...Ch. 14.3 - Prob. 99ECh. 14.3 - Prob. 100ECh. 14.3 - Prob. 101ECh. 14.3 - Prob. 102ECh. 14.3 - For Exercises 14.9814.103, a. compute SST, SSR,...Ch. 14.3 - Prob. 104ECh. 14.3 - In Exercises 14.10414.115, use the technology of...Ch. 14.3 - Prob. 106ECh. 14.3 - Prob. 107ECh. 14.3 - Prob. 108ECh. 14.3 - Prob. 109ECh. 14.3 - Prob. 110ECh. 14.3 - Prob. 111ECh. 14.3 - Prob. 112ECh. 14.3 - Prob. 113ECh. 14.3 - In Exercises 14.10414.115, use the technology of...Ch. 14.3 - In Exercises 14.10414.115, use the technology of...Ch. 14.3 - What can you say about SSE, SSR, and the utility...Ch. 14.3 - As we noted, because of the regression identity,...Ch. 14.4 - What is one purpose of the linear correlation...Ch. 14.4 - Prob. 119ECh. 14.4 - The symbol that is used for the linear correlation...Ch. 14.4 - A value of r close to 1 indicates that there is a...Ch. 14.4 - A value of r close to ____ indicates that there is...Ch. 14.4 - A value of r close to ____ indicates that the...Ch. 14.4 - A value of r close to 0 indicates that the...Ch. 14.4 - If y tends to increase linearly as x increases,...Ch. 14.4 - If y lends to decrease linearly as x increases,...Ch. 14.4 - If there is no linear relationship between x and...Ch. 14.4 - In each of Exercises 14.12814.130, determine...Ch. 14.4 - In each of Exercises 14.12814.130, determine...Ch. 14.4 - In each of Exercises 14.12814.130, determine...Ch. 14.4 - Answer true or false to the following statement...Ch. 14.4 - The linear correlation coefficient of a set of...Ch. 14.4 - The coefficient of determination of a set of data...Ch. 14.4 - In Exercises 14.13414.143, we repeat data from...Ch. 14.4 - In Exercises 14.13414.143, we repeat data from...Ch. 14.4 - In Exercises 14.13414.143, we repeat data front...Ch. 14.4 - Prob. 137ECh. 14.4 - In Exercises 14.13414.143, we repeat data from...Ch. 14.4 - In Exercises 14.13414.143, we repeat data from...Ch. 14.4 - In Exercises 14.13414.143, we repeat data from...Ch. 14.4 - In Exercises 14.13414.143, we repeat data from...Ch. 14.4 - In Exercises 14.13414.143, we repeat data from...Ch. 14.4 - In Exercises 14.13414.143, we repeat data from...Ch. 14.4 - In Exercises 14.14414.149, we repeat data from...Ch. 14.4 - In Exercises 14.14414.149, we repeat data from...Ch. 14.4 - In Exercises 14.14414.149, we repeat data from...Ch. 14.4 - Prob. 147ECh. 14.4 - In Exercises 14.14414.149, we repeat data from...Ch. 14.4 - In Exercises 14.14414.149, we repeat data from...Ch. 14.4 - Height and Score. A random sample of 10 students...Ch. 14.4 - Prob. 151ECh. 14.4 - Prob. 152ECh. 14.4 - Prob. 153ECh. 14.4 - Prob. 154ECh. 14.4 - In Exercise 14.154-14.166, use the technology of...Ch. 14.4 - Prob. 156ECh. 14.4 - Prob. 157ECh. 14.4 - Prob. 158ECh. 14.4 - Prob. 159ECh. 14.4 - Prob. 160ECh. 14.4 - Prob. 161ECh. 14.4 - In Exercises 14.154-14.166, use the technology of...Ch. 14.4 - In Exercises 14.15414.166, use the technology of...Ch. 14.4 - Prob. 164ECh. 14.4 - Prob. 165ECh. 14.4 - In Exercises 14.154-14.166, use the technology of...Ch. 14.4 - The coefficient of determination of a set of data...Ch. 14.4 - Country Music Blues. A Knight-Ridder News Service...Ch. 14.4 - Prob. 169ECh. 14.4 - In each of Exercises 14.169 and 14.170, a....Ch. 14 - For a linear equation y = b0 + b1x, identify the ...Ch. 14 - Consider the linear equation y = 4-3x. a. At what...Ch. 14 - In Problems 35, answer true or false to each...Ch. 14 - In Problems 35, answer true or false to each...Ch. 14 - In Problems 35, answer true or false to each...Ch. 14 - Prob. 6RPCh. 14 - In Problems 35, answer true or false to each...Ch. 14 - Prob. 8RPCh. 14 - In each of Problems 911, fill in the blank. 9....Ch. 14 - Prob. 10RPCh. 14 - Prob. 11RPCh. 14 - Prob. 12RPCh. 14 - Prob. 13RPCh. 14 - Prob. 14RPCh. 14 - Prob. 15RPCh. 14 - Prob. 16RPCh. 14 - Prob. 17RPCh. 14 - Prob. 18RPCh. 14 - Prob. 19RPCh. 14 - Equipment Depreciation. A small company has...Ch. 14 - Graduation Rates. Graduation ratethe percentage of...Ch. 14 - Graduation Rates. Refer to Problem 21. a....Ch. 14 - Graduation Rates. Refer to Problem 21. a. Compute...Ch. 14 - Exotic Plants. In the article Effects of Human...Ch. 14 - In Problems 2527, use the technology of your...Ch. 14 - Prob. 26RPCh. 14 - Prob. 27RPCh. 14 - Recall from Chapter 1 (see page 34) that the Focus...Ch. 14 - At the beginning of this chapter, we presented...
Knowledge Booster


Learn more about
Need a deep-dive on the concept behind this application? Look no further. Learn more about this topic, statistics and related others by exploring similar questions and additional content below.Similar questions
- In Exercises 9–24, find the equation of each of the circles from the given information.arrow_forward9. x-intercept (4, 0), y-intercept (0, -3)arrow_forwardThe annual per capita out-of-pocket expenses (to the nearest dollar) for U.S. health care for selected years from 2013 and projected to 2021 are shown in the table and figure. Year Dollars 2013 1020 2015 1022 2017 1097 2019 1209 2021 1325 A coordinate plane is given. The horizontal axis is labeled Year and the vertical axis is labeled Dollars per year. Four line segments connect five points. The point (2013, 1020) is connected to (2015, 1022), which is connected to (2017, 1097), which is connected to (2019, 1209), which is connected to (2021, 1325). (a) Use n = 4 equal subdivisions and right-hand endpoints to estimate the area under the graph from 2013 to 2021. $arrow_forward
- Find the quadratic equation that fits the following set of data points. {(1, – 6),(– 4, – 131),(3, - 54)} Write the equation in standard form, y = ax + bx + c. y =|arrow_forwardA) Draw a residual plot of the data. Explain why a linear model is appropriate for the data B) Suppose that the times have been recorded in seconds. For example, the time 34.12 minutes would be 2047 seconds. How would the value of r change?arrow_forwardPart 3 of 5 (c) Use the data points (4, 1.4) and (28, 2.6) to find an equation of the line through these points. Express numbers as decimals or integers. Write the answer in slope-intercept form (y=mx+b). The equation is 0=0 Ś Xarrow_forward
- Exercises 39–42: Decide whether a line can pass through the data points. If it can, determine the slope of the line. 1 2 3 4 39. y -1 3 7 11 15arrow_forwardThe percentage of automobile consumers who are under 50 years of age decreased approximately linearly from 53.8% in 1990 to 50.1% in 2000 .a.) Predict when the percentage will be 49%. b.) Predict the percentage in 2010arrow_forwardThe data in the table can be entered into a calculator to determine a linear equation of best fit where x represents the number of years with a company and y represents an employee's salary in dollars. Employee's Salary Years With Salary, y ($) Company, x 1 42,000 2 43,000 3 44,000 4 46,000 5 56.000 6 58,000 7 65,000 8 68,000 9 71,000 10 78,000 What conclusion can be drawn from the correlation coefficient associated with this linear equation? AFT A. There is a strong negative correlation between the variables. 2. There is a strong positive correlation between the variables C. There is a weak negative correlation between the variables. D. There is a weak positive correlation between the variables.arrow_forward
- b) Alcohol is different in that is removed linearly from the body. The following table shows the blood alcohol level (BAL) a number of hours after they start drinking. The data given below is for an average 30 year-old woman (130 pounds, 5 feet 5) woman and for an average 30 year-old man (180 pound man, 5 feet 10) who have each drunk 4 large glasses of wine. Use Excel to graph BAL amount against time elapsed for (i) an average man, and (ii) an average man. Graph and paste the chart(s) into your assignment. Blood Alcohol Level (Woman) Blood Alcohol Hours Elapsed Level (Man) 0.129 0.107 1 0.110 0.091 0.076 0.060 2. 0.091 3. 0.073 4. 0.054 0.045 0.035 0.029 6. 0.017 0.014 c) The legal DUI limit in Arizona is 0.080%. Estimate the amount of time (in minutes) needed between the last drink and getting behind the wheel. Better still designate a driver.arrow_forward0 3 11 2-1 Which equation represents the data in the table shown? A) y = -2x B) y = 2x + 3 C) y = -2x + 3 D) y=-2x - 3arrow_forwardExercises 39–42: Decide whether a line can pass through the data points. If it can, determine the slope of the line. 1 2 4 39. y -1 7 11 15 -4 -2 2 40. 1 -2 У 7 -5 - - 2 -5 -3 1 41. y -5 -2 1 4 7 4. 3. 3. 3.arrow_forward
arrow_back_ios
arrow_forward_ios
Recommended textbooks for you
 Algebra & Trigonometry with Analytic GeometryAlgebraISBN:9781133382119Author:SwokowskiPublisher:Cengage
 Elementary Geometry For College Students, 7eGeometryISBN:9781337614085Author:Alexander, Daniel C.; Koeberlein, Geralyn M.Publisher:Cengage,
 Algebra: Structure And Method, Book 1AlgebraISBN:9780395977224Author:Richard G. Brown, Mary P. Dolciani, Robert H. Sorgenfrey, William L. ColePublisher:McDougal Littell
Algebra & Trigonometry with Analytic Geometry
Algebra
ISBN:9781133382119
Author:Swokowski
Publisher:Cengage
Elementary Geometry For College Students, 7e
Geometry
ISBN:9781337614085
Author:Alexander, Daniel C.; Koeberlein, Geralyn M.
Publisher:Cengage,
Algebra: Structure And Method, Book 1
Algebra
ISBN:9780395977224
Author:Richard G. Brown, Mary P. Dolciani, Robert H. Sorgenfrey, William L. Cole
Publisher:McDougal Littell
Correlation Vs Regression: Difference Between them with definition & Comparison Chart; Author: Key Differences;https://www.youtube.com/watch?v=Ou2QGSJVd0U;License: Standard YouTube License, CC-BY
Correlation and Regression: Concepts with Illustrative examples; Author: LEARN & APPLY : Lean and Six Sigma;https://www.youtube.com/watch?v=xTpHD5WLuoA;License: Standard YouTube License, CC-BY