
Videos
The line graph shows the cost of inflation. What cost $10,000 in 1984 would cost the amount shown by the graph in subsequent years.
The Cost of Inflation
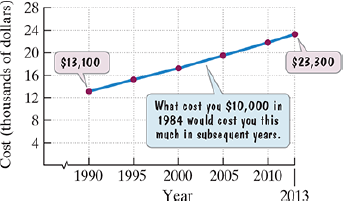
Source: U.S. Bureau of Labor Statistics
Here are two mathematical models for the data shown by the graph. In each formula, C represents the cost x years after 1990 of what cost $10,000 in 1984.


Use these models to solve Exercises 69 – 74.
Which model is a better description for the cost in 2013 of what cost $10,000 in 1984?
Does this model underestimate or overestimate the cost shown by the graph? By how much?
Want to see the full answer?
Check out a sample textbook solution
Chapter 1 Solutions
EBK INTERMEDIATE ALGEBRA FOR COLLEGE ST


- Question 4 Find the value of the first element for the first row of the inverse matrix of matrix B. 3 Not yet answered B = Marked out of 5.00 · (³ ;) Flag question 7 [Provide your answer as an integer number (no fraction). For a decimal number, round your answer to 2 decimal places] Answer:arrow_forwardQuestion 2 Not yet answered Multiply the following Matrices together: [77-4 A = 36 Marked out of -5 -5 5.00 B = 3 5 Flag question -6 -7 ABarrow_forwardAssume {u1, U2, u3, u4} does not span R³. Select the best statement. A. {u1, U2, u3} spans R³ if u̸4 is a linear combination of other vectors in the set. B. We do not have sufficient information to determine whether {u₁, u2, u3} spans R³. C. {U1, U2, u3} spans R³ if u̸4 is a scalar multiple of another vector in the set. D. {u1, U2, u3} cannot span R³. E. {U1, U2, u3} spans R³ if u̸4 is the zero vector. F. none of the abovearrow_forward
- Select the best statement. A. If a set of vectors includes the zero vector 0, then the set of vectors can span R^ as long as the other vectors are distinct. n B. If a set of vectors includes the zero vector 0, then the set of vectors spans R precisely when the set with 0 excluded spans Rª. ○ C. If a set of vectors includes the zero vector 0, then the set of vectors can span Rn as long as it contains n vectors. ○ D. If a set of vectors includes the zero vector 0, then there is no reasonable way to determine if the set of vectors spans Rn. E. If a set of vectors includes the zero vector 0, then the set of vectors cannot span Rn. F. none of the abovearrow_forwardWhich of the following sets of vectors are linearly independent? (Check the boxes for linearly independent sets.) ☐ A. { 7 4 3 13 -9 8 -17 7 ☐ B. 0 -8 3 ☐ C. 0 ☐ D. -5 ☐ E. 3 ☐ F. 4 THarrow_forward3 and = 5 3 ---8--8--8 Let = 3 U2 = 1 Select all of the vectors that are in the span of {u₁, u2, u3}. (Check every statement that is correct.) 3 ☐ A. The vector 3 is in the span. -1 3 ☐ B. The vector -5 75°1 is in the span. ГОЛ ☐ C. The vector 0 is in the span. 3 -4 is in the span. OD. The vector 0 3 ☐ E. All vectors in R³ are in the span. 3 F. The vector 9 -4 5 3 is in the span. 0 ☐ G. We cannot tell which vectors are i the span.arrow_forward
- (20 p) 1. Find a particular solution satisfying the given initial conditions for the third-order homogeneous linear equation given below. (See Section 5.2 in your textbook if you need a review of the subject.) y(3)+2y"-y-2y = 0; y(0) = 1, y'(0) = 2, y"(0) = 0; y₁ = e*, y2 = e¯x, y3 = e−2x (20 p) 2. Find a particular solution satisfying the given initial conditions for the second-order nonhomogeneous linear equation given below. (See Section 5.2 in your textbook if you need a review of the subject.) y"-2y-3y = 6; y(0) = 3, y'(0) = 11 yc = c₁ex + c2e³x; yp = −2 (60 p) 3. Find the general, and if possible, particular solutions of the linear systems of differential equations given below using the eigenvalue-eigenvector method. (See Section 7.3 in your textbook if you need a review of the subject.) = a) x 4x1 + x2, x2 = 6x1-x2 b) x=6x17x2, x2 = x1-2x2 c) x = 9x1+5x2, x2 = −6x1-2x2; x1(0) = 1, x2(0)=0arrow_forwardFind the perimeter and areaarrow_forwardAssume {u1, U2, us} spans R³. Select the best statement. A. {U1, U2, us, u4} spans R³ unless u is the zero vector. B. {U1, U2, us, u4} always spans R³. C. {U1, U2, us, u4} spans R³ unless u is a scalar multiple of another vector in the set. D. We do not have sufficient information to determine if {u₁, u2, 43, 114} spans R³. OE. {U1, U2, 3, 4} never spans R³. F. none of the abovearrow_forward
- Assume {u1, U2, 13, 14} spans R³. Select the best statement. A. {U1, U2, u3} never spans R³ since it is a proper subset of a spanning set. B. {U1, U2, u3} spans R³ unless one of the vectors is the zero vector. C. {u1, U2, us} spans R³ unless one of the vectors is a scalar multiple of another vector in the set. D. {U1, U2, us} always spans R³. E. {U1, U2, u3} may, but does not have to, span R³. F. none of the abovearrow_forwardLet H = span {u, v}. For each of the following sets of vectors determine whether H is a line or a plane. Select an Answer u = 3 1. -10 8-8 -2 ,v= 5 Select an Answer -2 u = 3 4 2. + 9 ,v= 6arrow_forwardSolve for the matrix X: X (2 7³) x + ( 2 ) - (112) 6 14 8arrow_forward
 Glencoe Algebra 1, Student Edition, 9780079039897...AlgebraISBN:9780079039897Author:CarterPublisher:McGraw Hill
 College AlgebraAlgebraISBN:9781305115545Author:James Stewart, Lothar Redlin, Saleem WatsonPublisher:Cengage Learning
 Mathematics For Machine TechnologyAdvanced MathISBN:9781337798310Author:Peterson, John.Publisher:Cengage Learning,
 Trigonometry (MindTap Course List)TrigonometryISBN:9781337278461Author:Ron LarsonPublisher:Cengage Learning
 Functions and Change: A Modeling Approach to Coll...AlgebraISBN:9781337111348Author:Bruce Crauder, Benny Evans, Alan NoellPublisher:Cengage Learning