Concept explainers
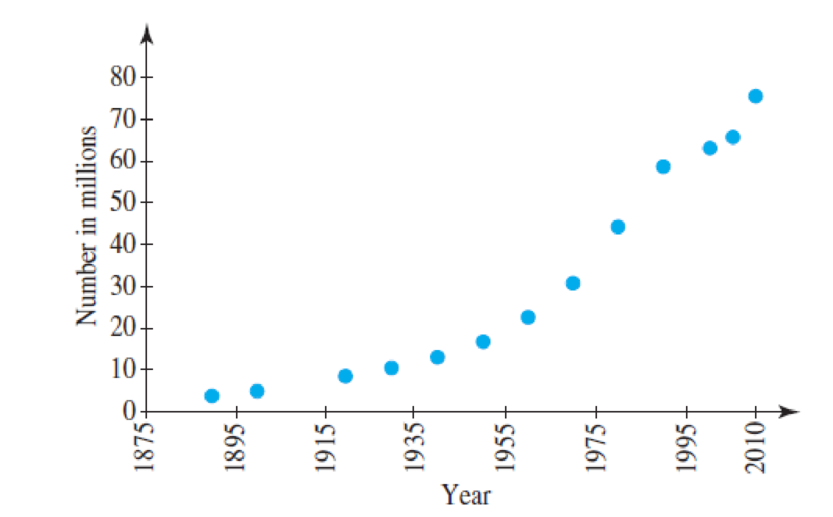
Women in the Workforce The number of women in the workforce (in millions) for selected years from 1890 to 2010 is shown in the following figure.
a. Would the data in the
b. The number of women in the workforce was 10.519 million in 1930 and 16.443 million in 1950. What is the average rate of change in the number of women in the workforce during this period?
c. If the number of women in the workforce was 16.443 million in 1950 and 75.500 million in 2010, what is the average rate of change in the number of women in the workforce during this period?
d. Is it reasonable that these two average rates of change are different? How can you tell this from the graph?

(Source: Newsweek)
Want to see the full answer?
Check out a sample textbook solution
Chapter 1 Solutions
College Algebra in Context with Applications for the Managerial, Life, and Social Sciences (5th Edition)
- 3. (a) Lety: [a, b] C be a contour. Let L(y) denote the length of y. Give a formula for L(y). (1 mark) (b) Let UCC be open. Let f: U→C be continuous. Let y: [a,b] → U be a contour. Suppose there exists a finite real number M such that |f(z)| < M for all z in the image of y. Prove that < ||, f(z)dz| ≤ ML(y). (3 marks) (c) State and prove Liouville's theorem. You may use Cauchy's integral formula without proof. (d) Let R0. Let w € C. Let (10 marks) U = { z Є C : | z − w| < R} . Let f UC be a holomorphic function such that 0 < |ƒ(w)| < |f(z)| for all z Є U. Show, using the local maximum modulus principle, that f is constant. (6 marks)arrow_forward3. (a) Let A be an algebra. Define the notion of an A-module M. When is a module M a simple module? (b) State and prove Schur's Lemma for simple modules. (c) Let AM(K) and M = K" the natural A-module. (i) Show that M is a simple K-module. (ii) Prove that if ƒ € Endд(M) then ƒ can be written as f(m) = am, where a is a matrix in the centre of M, (K). [Recall that the centre, Z(M,(K)) == {a Mn(K) | ab M,,(K)}.] = ba for all bЄ (iii) Explain briefly why this means End₁(M) K, assuming that Z(M,,(K))~ K as K-algebras. Is this consistent with Schur's lemma?arrow_forward(a) State, without proof, Cauchy's theorem, Cauchy's integral formula and Cauchy's integral formula for derivatives. Your answer should include all the conditions required for the results to hold. (8 marks) (b) Let U{z EC: |z| -1}. Let 12 be the triangular contour with vertices at 0, 2-2 and 2+2i, parametrized in the anticlockwise direction. Calculate dz. You must check the conditions of any results you use. (d) Let U C. Calculate Liz-1ym dz, (z - 1) 10 (5 marks) where 2 is the same as the previous part. You must check the conditions of any results you use. (4 marks)arrow_forward
- (a) Suppose a function f: C→C has an isolated singularity at wЄ C. State what it means for this singularity to be a pole of order k. (2 marks) (b) Let f have a pole of order k at wЄ C. Prove that the residue of f at w is given by 1 res (f, w): = Z dk (k-1)! >wdzk−1 lim - [(z — w)* f(z)] . (5 marks) (c) Using the previous part, find the singularity of the function 9(z) = COS(πZ) e² (z - 1)²' classify it and calculate its residue. (5 marks) (d) Let g(x)=sin(211). Find the residue of g at z = 1. (3 marks) (e) Classify the singularity of cot(z) h(z) = Z at the origin. (5 marks)arrow_forward1. Let z = x+iy with x, y Є R. Let f(z) = u(x, y) + iv(x, y) where u(x, y), v(x, y): R² → R. (a) Suppose that f is complex differentiable. State the Cauchy-Riemann equations satisfied by the functions u(x, y) and v(x,y). (b) State what it means for the function (2 mark) u(x, y): R² → R to be a harmonic function. (3 marks) (c) Show that the function u(x, y) = 3x²y - y³ +2 is harmonic. (d) Find a harmonic conjugate of u(x, y). (6 marks) (9 marks)arrow_forwardPlease could you provide a step by step solutions to this question and explain every step.arrow_forward
- Could you please help me with question 2bii. If possible could you explain how you found the bounds of the integral by using a graph of the region of integration. Thanksarrow_forwardLet A be a vector space with basis 1, a, b. Which (if any) of the following rules turn A into an algebra? (You may assume that 1 is a unit.) (i) a² = a, b² = ab = ba = 0. (ii) a²=b, b² = ab = ba = 0. (iii) a²=b, b² = b, ab = ba = 0.arrow_forwardNo chatgpt pls will upvotearrow_forward
- = 1. Show (a) Let G = Z/nZ be a cyclic group, so G = {1, 9, 92,...,g" } with g": that the group algebra KG has a presentation KG = K(X)/(X” — 1). (b) Let A = K[X] be the algebra of polynomials in X. Let V be the A-module with vector space K2 and where the action of X is given by the matrix Compute End(V) in the cases (i) x = p, (ii) xμl. (67) · (c) If M and N are submodules of a module L, prove that there is an isomorphism M/MON (M+N)/N. (The Second Isomorphism Theorem for modules.) You may assume that MON is a submodule of M, M + N is a submodule of L and the First Isomorphism Theorem for modules.arrow_forward(a) Define the notion of an ideal I in an algebra A. Define the product on the quotient algebra A/I, and show that it is well-defined. (b) If I is an ideal in A and S is a subalgebra of A, show that S + I is a subalgebra of A and that SnI is an ideal in S. (c) Let A be the subset of M3 (K) given by matrices of the form a b 0 a 0 00 d Show that A is a subalgebra of M3(K). Ꮖ Compute the ideal I of A generated by the element and show that A/I K as algebras, where 0 1 0 x = 0 0 0 001arrow_forward(a) Let HI be the algebra of quaternions. Write out the multiplication table for 1, i, j, k. Define the notion of a pure quaternion, and the absolute value of a quaternion. Show that if p is a pure quaternion, then p² = -|p|². (b) Define the notion of an (associative) algebra. (c) Let A be a vector space with basis 1, a, b. Which (if any) of the following rules turn A into an algebra? (You may assume that 1 is a unit.) (i) a² = a, b²=ab = ba 0. (ii) a² (iii) a² = b, b² = abba = 0. = b, b² = b, ab = ba = 0. (d) Let u1, 2 and 3 be in the Temperley-Lieb algebra TL4(8). ገ 12 13 Compute (u3+ Augu2)² where A EK and hence find a non-zero x € TL4 (8) such that ² = 0.arrow_forward
 College Algebra (MindTap Course List)AlgebraISBN:9781305652231Author:R. David Gustafson, Jeff HughesPublisher:Cengage Learning
 College AlgebraAlgebraISBN:9781305115545Author:James Stewart, Lothar Redlin, Saleem WatsonPublisher:Cengage Learning
 Algebra and Trigonometry (MindTap Course List)AlgebraISBN:9781305071742Author:James Stewart, Lothar Redlin, Saleem WatsonPublisher:Cengage Learning
 Trigonometry (MindTap Course List)TrigonometryISBN:9781337278461Author:Ron LarsonPublisher:Cengage Learning
 Glencoe Algebra 1, Student Edition, 9780079039897...AlgebraISBN:9780079039897Author:CarterPublisher:McGraw Hill


