
Elementary Statistics (13th Edition)
13th Edition
ISBN: 9780134462455
Author: Mario F. Triola
Publisher: PEARSON
expand_more
expand_more
format_list_bulleted
Concept explainers
Videos
Textbook Question
Chapter 14, Problem 4RE
Energy Consumption. Exercises 1–5 refer to the amounts of energy consumed in the author's home. (Most of the data are real, but some are fabricated.) Each value represents energy consumed (kWh) in a two-month period. Let each subgroup consist of the six amounts within the same year. Data are available for download at www.TriolaStats.com.
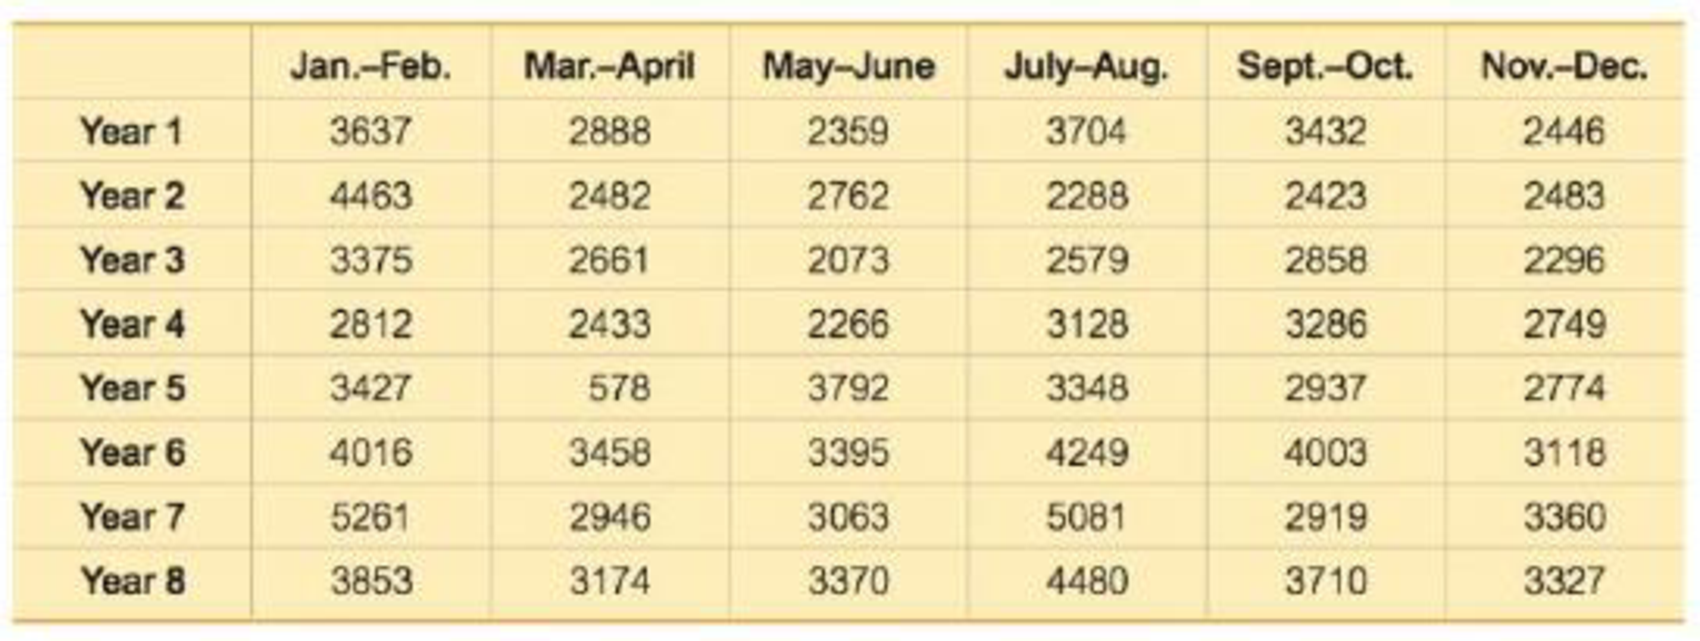
4. Energy Consumption: Run Chart Construct a run chart for the 48 values. Does there appear to be a pattern suggesting that the process is not within statistical control?
Expert Solution & Answer
Want to see the full answer?
Check out a sample textbook solution
Students have asked these similar questions
Please could you explain why 0.5 was added to each upper limpit of the intervals.Thanks
28. (a) Under what conditions do we say that two random variables X and Y are
independent?
(b) Demonstrate that if X and Y are independent, then it follows that E(XY) =
E(X)E(Y);
(e) Show by a counter example that the converse of (ii) is not necessarily true.
1. Let X and Y be random variables and suppose that A = F. Prove that
Z XI(A)+YI(A) is a random variable.
Chapter 14 Solutions
Elementary Statistics (13th Edition)
Ch. 14.1 - FAA Requirement Table 14-1 on page 655 lists...Ch. 14.1 - Prob. 2BSCCh. 14.1 - Prob. 3BSCCh. 14.1 - Prob. 4BSCCh. 14.1 - Prob. 5BSCCh. 14.1 - Prob. 6BSCCh. 14.1 - Prob. 7BSCCh. 14.1 - Pepsi Cans. In Exercises 5-8, refer to the axial...Ch. 14.1 - Prob. 9BSCCh. 14.1 - Prob. 10BSC
Ch. 14.1 - Quarters. In Exercises 9-12, refer to the...Ch. 14.1 - Prob. 12BSCCh. 14.1 - Prob. 13BBCh. 14.1 - Prob. 14BBCh. 14.2 - Statistical Literacy and Critical Thinking 1....Ch. 14.2 - Prob. 2BSCCh. 14.2 - Control Limits In constructing a control chart for...Ch. 14.2 - Euro Coins After constructing a control chart for...Ch. 14.2 - Control Charts for p. In Exercises 5-12, use the...Ch. 14.2 - Control Charts for p. In Exercises 5-12, use the...Ch. 14.2 - Prob. 7BSCCh. 14.2 - Control Charts for p. In Exercises 5-12, use the...Ch. 14.2 - Control Charts for p. In Exercises 5-12, use the...Ch. 14.2 - Control Charts for p. In Exercises 5-12, use the...Ch. 14.2 - Control Charts for p. In Exercises 5-12, use the...Ch. 14.2 - Control Charts for p. In Exercises 5-12, use the...Ch. 14.2 - Prob. 13BBCh. 14 - What are process data?Ch. 14 - Prob. 2CQQCh. 14 - Prob. 3CQQCh. 14 - Prob. 4CQQCh. 14 - Prob. 5CQQCh. 14 - Prob. 6CQQCh. 14 - Prob. 7CQQCh. 14 - Prob. 8CQQCh. 14 - Prob. 9CQQCh. 14 - Prob. 10CQQCh. 14 - Prob. 1RECh. 14 - Prob. 2RECh. 14 - Prob. 3RECh. 14 - Energy Consumption. Exercises 15 refer to the...Ch. 14 - Prob. 5RECh. 14 - Prob. 1CRECh. 14 - Prob. 2CRECh. 14 - Prob. 3CRECh. 14 - Internet Doctors: Probability Based on the survey...Ch. 14 - Sunspots and the DJIA Listed below are annual...Ch. 14 - Prob. 6CRECh. 14 - Prob. 7CRECh. 14 - Defective Child Restraint Systems The Tracolyte...Ch. 14 - Prob. 9CRECh. 14 - Does It Pay to Plead Guilty? The accompanying...Ch. 14 - FROM DATA TO DECISION Critical Thinking: Are the...
Knowledge Booster


Learn more about
Need a deep-dive on the concept behind this application? Look no further. Learn more about this topic, statistics and related others by exploring similar questions and additional content below.Similar questions
- (c) Utilize Fubini's Theorem to demonstrate that E(X)= = (1- F(x))dx.arrow_forward(c) Describe the positive and negative parts of a random variable. How is the integral defined for a general random variable using these components?arrow_forward26. (a) Provide an example where X, X but E(X,) does not converge to E(X).arrow_forward
- (b) Demonstrate that if X and Y are independent, then it follows that E(XY) E(X)E(Y);arrow_forward(d) Under what conditions do we say that a random variable X is integrable, specifically when (i) X is a non-negative random variable and (ii) when X is a general random variable?arrow_forward29. State the Borel-Cantelli Lemmas without proof. What is the primary distinction between Lemma 1 and Lemma 2?arrow_forward
arrow_back_ios
SEE MORE QUESTIONS
arrow_forward_ios
Recommended textbooks for you
 MATLAB: An Introduction with ApplicationsStatisticsISBN:9781119256830Author:Amos GilatPublisher:John Wiley & Sons Inc
 Probability and Statistics for Engineering and th...StatisticsISBN:9781305251809Author:Jay L. DevorePublisher:Cengage Learning
 Statistics for The Behavioral Sciences (MindTap C...StatisticsISBN:9781305504912Author:Frederick J Gravetter, Larry B. WallnauPublisher:Cengage Learning
 Elementary Statistics: Picturing the World (7th E...StatisticsISBN:9780134683416Author:Ron Larson, Betsy FarberPublisher:PEARSON
 The Basic Practice of StatisticsStatisticsISBN:9781319042578Author:David S. Moore, William I. Notz, Michael A. FlignerPublisher:W. H. Freeman
 Introduction to the Practice of StatisticsStatisticsISBN:9781319013387Author:David S. Moore, George P. McCabe, Bruce A. CraigPublisher:W. H. Freeman
MATLAB: An Introduction with Applications
Statistics
ISBN:9781119256830
Author:Amos Gilat
Publisher:John Wiley & Sons Inc
Probability and Statistics for Engineering and th...
Statistics
ISBN:9781305251809
Author:Jay L. Devore
Publisher:Cengage Learning
Statistics for The Behavioral Sciences (MindTap C...
Statistics
ISBN:9781305504912
Author:Frederick J Gravetter, Larry B. Wallnau
Publisher:Cengage Learning
Elementary Statistics: Picturing the World (7th E...
Statistics
ISBN:9780134683416
Author:Ron Larson, Betsy Farber
Publisher:PEARSON
The Basic Practice of Statistics
Statistics
ISBN:9781319042578
Author:David S. Moore, William I. Notz, Michael A. Fligner
Publisher:W. H. Freeman
Introduction to the Practice of Statistics
Statistics
ISBN:9781319013387
Author:David S. Moore, George P. McCabe, Bruce A. Craig
Publisher:W. H. Freeman
Learn Algebra 6 : Rate of Change; Author: Derek Banas;https://www.youtube.com/watch?v=Dw701mKcJ1k;License: Standard YouTube License, CC-BY