
Econ Micro (book Only)
6th Edition
ISBN: 9781337408066
Author: William A. McEachern
Publisher: Cengage Learning
expand_more
expand_more
format_list_bulleted
Videos
Textbook Question
Chapter 14, Problem 4P
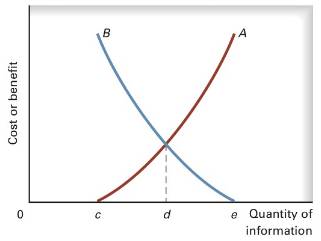
(Search with imperfect Information) The following questions concern the accompanying graph.
a. Identify the two curves shown on the graph, and explain their upward or downward slopes.
b. Why does curve A intersect the horizontal axis?
c. What is the significance of quantity d?
d. What does e represent?
e. How would the optimal quantity of information change if the marginal benefit of information increased—that is, if the marginal benefit curve shifted upward?
Expert Solution & Answer
Want to see the full answer?
Check out a sample textbook solution
Students have asked these similar questions
Question 1. [Utility Maximization and Choice]
Tom's utility on two goods, x and y, is presented as below.
utility = U(x, y) = √√xy
a)(s) If x costs $1 each and y costs $2 each, determine his utility-maximizing consumption
quantities for x and y, assuming he is spending all his money endowment of $10.
b) () Suppose x price drops to $0.5. How much money can Tom save if he adjusts his
consumption quantities of x and y such that he remains at the same level of utility he received in
part a)?
# 4
can you explain what the correct answer is and why?
34. How do i solve this question
Knowledge Booster


Learn more about
Need a deep-dive on the concept behind this application? Look no further. Learn more about this topic, economics and related others by exploring similar questions and additional content below.Similar questions
- 2.Answer the question.arrow_forward1.What is the message that P&G wants to send to its customers? 2. According to your opinion, what does the benefit P&G gain when they implemented theThank you Mom campaign’? 3. What kind of emotions does this video evoke in you? Explain what you felt and why. (there are no wrong answers here, just you thinking )arrow_forwardQ4) Marginal Utility Use the table to calculate then draw marginal utility, show your calculations, graph, and then answer two questions. Popcorn Consumption 0 First box Second box Third box Fourth box Fifth box Sixth box Total Utility 0 20 35 44 49 50 40 a. With which box of popcorn does marginal utility first diminish? b. With which box does marginal utility become negative?arrow_forward
- 2. can you explain how you find out each part?arrow_forward2) Stan bought a car three years ago for $20,000. Recently he got a promotion and is deciding whether to keep his old car or to buy a new one. His dealer told him that the current market price of his old car is $15,000. The car maintenance costs are $1,000 now, and they are going to increase each year by at least $500. Stan compares his old car with a new one that, he calculates, would have an equivalent annual cost of $4 ,100. What is Stan's optimal decision if his current interest rate is 7%?arrow_forwardUse the graph input tool to help you answer the following questions. You will not be graded on any changes you make to this graph. Note: Once you enter a value in a white field, the graph and any corresponding amounts in each grey field will change accordingly. PRICE (Dollars per room) 500 450 400 350 300 250 200 150 100 50 0 1 1 T Demand 0 50 100 150 200 250 300 350 400 450 500 QUANTITY (Hotel rooms) Graph Input Tool Market for Big Winner's Hotel Rooms Price (Dollars per room) Quantity Demanded (Hotel rooms per night) Demand Factors Average Income (Thousands of dollars) Airfare from LAX to LAS (Dollars per roundtrip) Room Rate at Lucky (Dollars per night) 200 300 50 100 250 For each of the following scenarios, begin by assuming that all demand factors are set to their original values and Big Winner is charging $200 perarrow_forward
- Topic: indirect utility function i need part a,b,carrow_forward(a) Draw a graph showing price ceiling on face masks to protect consumers from high prices that are being charged. (b) Draw a graph showing an increase in demand for face masks to protect person from coronavirus in the USA.arrow_forwardList any Two software that could be used for creating visual information 2.Mention the type of visual information that they are used for. 3.Use one of the software to create one visual information.Make up your own data for the creation of the visual informationarrow_forward
arrow_back_ios
SEE MORE QUESTIONS
arrow_forward_ios
Recommended textbooks for you

The CASH FLOW STATEMENT for BEGINNERS; Author: Accounting Stuff;https://www.youtube.com/watch?v=DiVPAjgmnj0;License: Standard Youtube License