
1.
Prepare an interim quality cost performance report for the year 2015 that compares actual quality costs with budgeted quality costs and comment on the ability of the firm for achieving its quality goals for the year.
1.
Explanation of Solution
Quality cost performance reports: In a quality cost performance report, identification of quality standard is the main element and it has two important elements namely; actual outcomes and expected or standard outcomes.
Interim quality report: Interim quality performance report compares the actual quality at the end of the period with the budgeted costs and this report examines the progress attained within the period comparative to the planned level of progress for that period.
Prepare an interim quality cost performance report for the year 2015:
| Company I | ||||
| Interim Performance Report: Quality Costs | ||||
| For the Year Ended December 31, 2015 | ||||
| Particulars |
Actual Costs (a) |
Budgeted costs (b) |
Variance | |
| Prevention costs: | ||||
| Fixed: | ||||
| Quality planning | $150,000 | $150,000 | $0 | |
| Quality training | $20,000 | $20,000 | $0 | |
| Quality improvement | $100,000 | $80,000 | $20,000 | U |
| Quality reporting | $12,000 | $10,000 | $2,000 | U |
| Total prevention costs | $282,000 | 260,000 | $22,000 | U |
| Appraisal costs: | ||||
| Variable: | ||||
| Proofreading | $520,000 | $500,000 | $20,000 | U |
| Other inspection | $60,000 | $50,000 | $10,000 | U |
| Total appraisal costs | $580,000 | 550,000 | $30,000 | U |
| Failure costs: | ||||
| Variable: | ||||
| Correction of typos | $165,000 | $150,000 | $15,000 | U |
| Rework | $76,000 | $75,000 | $1,000 | U |
| Plate revisions | $58,000 | $55,000 | $3,000 | U |
| Press downtime | $102,000 | $100,000 | $2,000 | U |
| Waste | $ 136,000 | $130,000 | $ 6,000 | U |
| Total failure costs | $537,000 | $510,000 | $27,000 | U |
| Total quality costs | $1,399,000 | $1,320,000 | $79,000 | U |
Table (1)
Every single category and each individual item are equivalent to or higher than the budgeted amounts. Therefore, the firm cannot achieve its budgeted goals for the year.
2.
Prepare a one-period quality performance report for 2015 that compares the actual quality costs of 2014 with the actual costs of 2015 and state the amount of change in profit due to improvement in quality.
2.
Explanation of Solution
Prepare a one-period quality performance report for 2015:
| Company I | ||||
| Performance Report: Quality Costs | ||||
| One-Year Trend | ||||
| For the Year Ended December 31, 2015 | ||||
| Particulars |
Actual Costs 2015 (a) |
Actual Costs 2014 (b) |
Variance | |
| Prevention costs: | ||||
| Fixed: | ||||
| Quality planning | $150,000 | $140,000 | ($10,000) | U |
| Quality training | $20,000 | $20,000 | $0 | |
| Quality improvement | $100,000 | $120,000 | $20,000 | F |
| Quality reporting | $12,000 | $12,000 | $0 | |
| Total prevention costs | $282,000 | $292,000 | $10,000 | F |
| Appraisal costs: | ||||
| Variable: | ||||
| Proofreading | $520,000 | $580,000 | $60,000 | F |
| Other inspection | $60,000 | $80,000 | $20,000 | F |
| Total appraisal costs | $580,000 | $660,000 | $80,000 | F |
| Failure costs: | ||||
| Variable: | ||||
| Correction of typos | $165,000 | $200,000 | $35,000 | F |
| Rework | $76,000 | $131,000 | $55,000 | F |
| Plate revisions | $58,000 | $83,000 | $25,000 | F |
| Press downtime | $102,000 | $123,000 | $21,000 | F |
| Waste | $ 136,000 | $191,000 | $ 55,000 | F |
| Total failure costs | $537,000 | $728,000 | $191,000 | F |
| Total quality costs | $1,399,000 | $1,680,000 | $281,000 | F |
Table (2)
- The quality cost reduced from 2014 to 2015; therefore, the profit increased to $281,000. There is still considerable improvement even though the budgeted reductions for the year are not met.
- Additionally, the improvement was due to the “reduction of failure costs” which is a positive sign denoting that quality is certainly increasing.
3.
Prepare a graph that shows the trend in total quality costs as a percentage of sales since the inception of the quality improvement program.
3.
Explanation of Solution
Multiple-period quality trend reports: Multiple-period quality trend reports is a chart or graph that tracks the change in quality from the starting of the program to the present.
Prepare a graph:
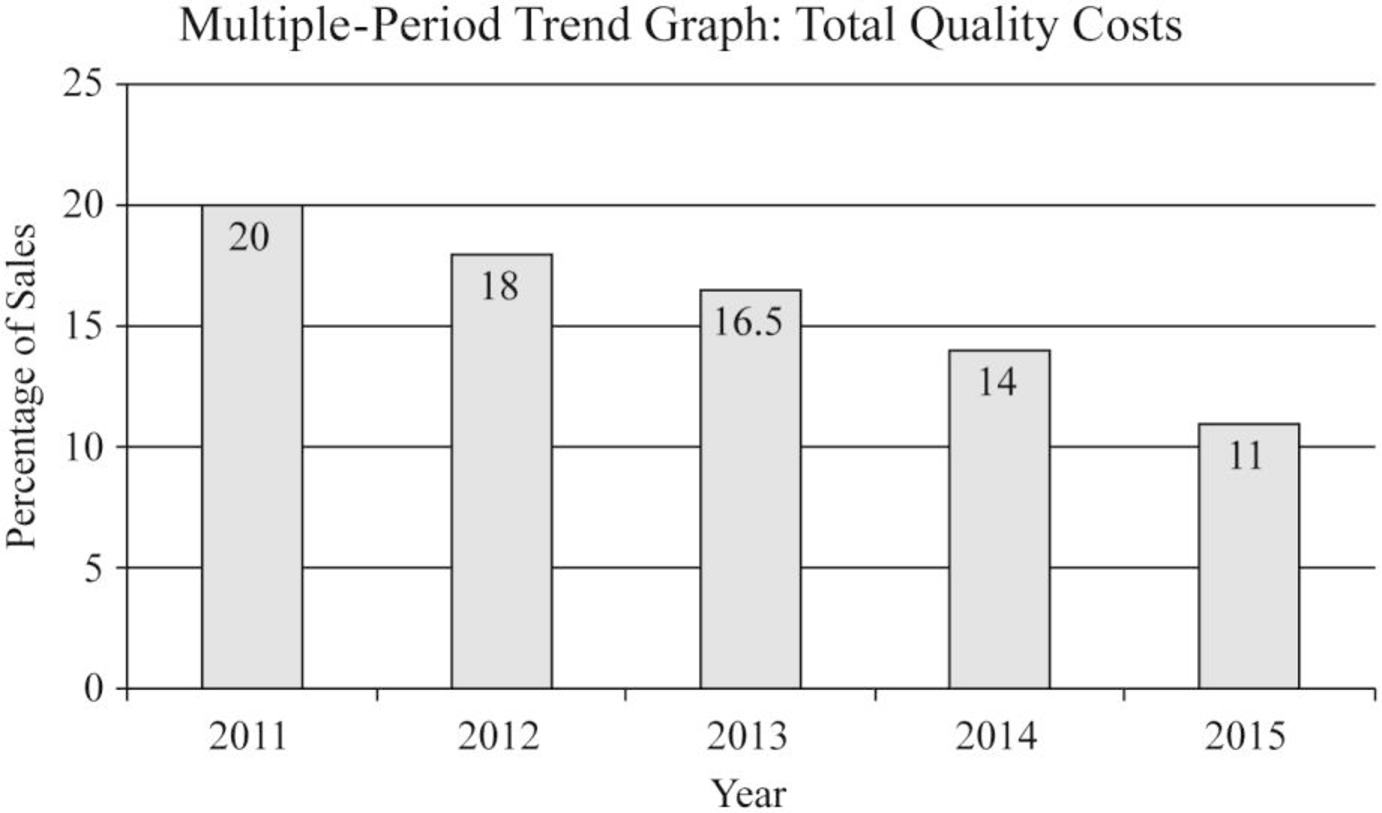
Figure (1)
Working notes:
(1)Calculate the percent of sales:
| Year |
Quality Costs (a) |
Sales Revenues (b) |
Percent of sales |
| 2011 | $2,000,000 | $10,000,000 | 20% |
| 2012 | $1,800,000 | $10,000,000 | 18% |
| 2013 | $1,815,000 | $11,000,000 | 16.5% |
| 2014 | $1,680,000 | $12,000,000 | 14% |
| 2015 | $1,320,000 | $12,000,000 | 11.65% |
Table (3)
4.
Prepare a graph that shows the trend for all four quality cost categories for 2011 through 2015 and state the manner in which the graphs helps management to know that the reduction in total quality costs is attributable to quality improvement.
4.
Explanation of Solution
Prepare a graph:
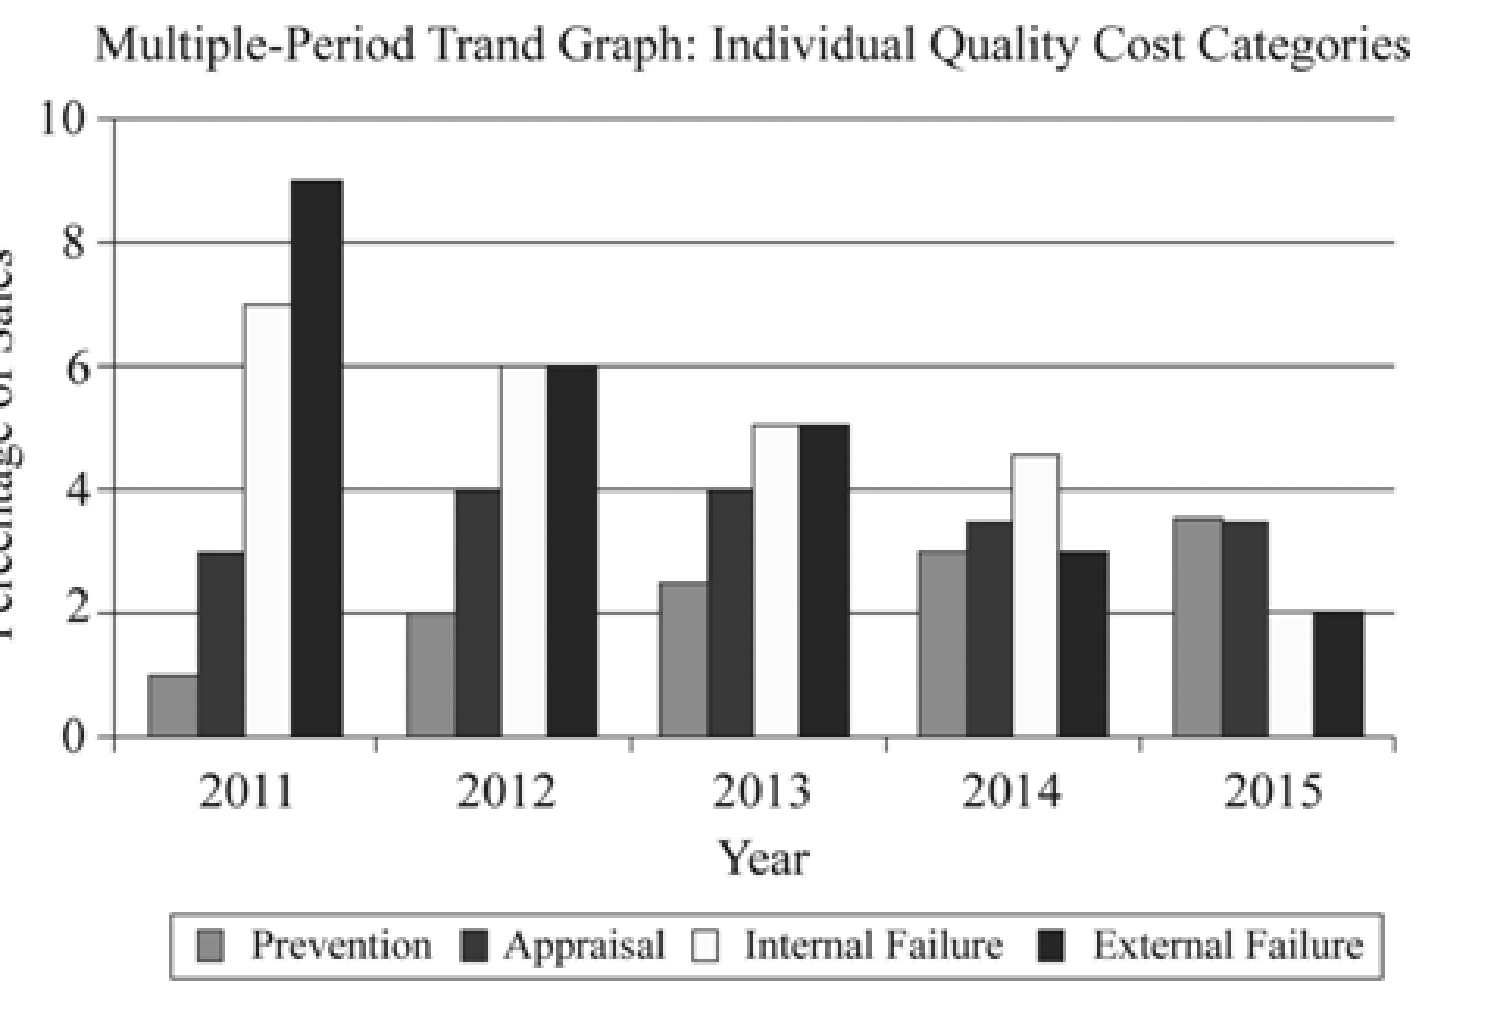
Figure (2)
“Increases in prevention and appraisal costs” along with simultaneous decrease in failure costs are good indication that in general quality is increasing. It is to be noted, that decreases in external failure costs are mostly difficult to attain without increase in actual quality.
5.
Prepare a long-range quality cost performance report.
5.
Explanation of Solution
Long-range performance report: Long-range performance report compares the “current actual” with the costs that will be allowed if the “zero-defects standard” is being met by assuming that sales level is equal to that of the existing period.
Prepare a long-range quality cost performance report:
| Company I | ||||
| Performance Report: Quality Costs | ||||
| One-Year Trend | ||||
| For the Year Ended December 31, 2015 | ||||
| Particulars |
Actual Costs 2015 (a) |
Long-Range Target Costs (b) |
Variance | |
| Prevention costs: | ||||
| Fixed: | ||||
| Quality planning | $150,000 | $0 | $150,000 | U |
| Quality training | $20,000 | (9)$112,500 | ($92,500) | F |
| Quality improvement | $100,000 | $0 | $100,000 | U |
| Quality reporting | $12,000 | (10)$26,250 | ( $14,250) | F |
| Total prevention costs | $282,000 | $138,750 | $143,250 | U |
| Appraisal costs: | ||||
| Variable: | ||||
| Proofreading | (2)$650,000 | (11)$187,500 | $462,500 | U |
| Other inspection | (3) $75,000 | (12)$48,750 | $26,250 | U |
| Total appraisal costs | $725,000 | $236,250 | $488,750 | U |
| Failure costs: | ||||
| Variable: | ||||
| Correction of typos | (4)$206,250 | $0 | $206,250 | U |
| Rework | (5)$95,000 | $0 | $95,000 | U |
| Plate revisions | (6)$72,500 | $0 | $72,500 | U |
| Press downtime | (7)$127,500 | $0 | $127,500 | U |
| Waste | (8) $170,000 | $0 | $170,000 | U |
| Total failure costs | $671,250 | $0 | $671,250 | U |
| Total quality costs | $1,678,250 | $375,000 | $1,303,250 | U |
Table (4)
Note: Apart from for prevention costs, which is a fixed cost, actual costs of 2015, are adjusted to a sales level of $15 million.
Workings notes:
(2)Calculate the proofreading costs:
(3)Calculate the other inspection costs:
(4)Calculate the correction of typos costs:
(5)Calculate the rework costs:
(6)Calculate the plate revision costs:
(7)Calculate the press downtime costs:
(8)Calculate the cost of waste:
(9)Calculate the long-range target costs for quality training:
(10)Calculate the long-range target costs for quality reporting:
(11)Calculate the long-range target costs for proofreading:
(12)Calculate the long-range target costs for other inspection:
(13)Calculate the amount of total quality costs:
Want to see more full solutions like this?
Chapter 14 Solutions
EBK CORNERSTONES OF COST MANAGEMENT

- Kirkland Company combines its operating expenses for budget purposes in a selling and administrative expense budget. For the first 6 months of 2020, the following data are available. 1. Sales: 20,300 units quarter 1; 22,000 units quarter 2. 2. Variable costs per dollar of sales: sales commissions 5%, delivery expense 2%, and advertising 3%. 3. Fixed costs per quarter: sales salaries $10,200, office salaries $6,160, depreciation $4,730, insurance $1,660, utilities $890, and repairs expense $610. 4. Unit selling price: $22. Prepare a selling and administrative expense budget by quarters for the first 6 months of 2020. (List variable expenses before fixed expense.) KIRKLAND COMPANY Selling and Administrative Expense Budget Quarter 1 2 Six Monthsarrow_forwardMerchant Industries is preparing its master budget for 2016. Relevant data pertaining to its sales budget are as follows: Sales for the year are expected to total 8,000,000 units. Quarterly sales are 25%, 30%, 15%, and 30%, respectively. The sales price is expected to be $2.00 per unit for the first quarter and then be increased to $2.20 per unit in the second quarter. Instructions Prepare a sales budget for 2016 for Merchant Industries.arrow_forwardABC Company is preparing its master budget for 2014. Relevant data pertaining to its sales, I production, and direct materials budgets are as follows. Sales. Sales for the year are expected to total 1,200,000 units. Quarterly sales, as a percentage of total sales, are 20%, 25%, 30%, and 25%, respectively. The sales price is expected to be 50 per unit for the first three quarters and 55 per unit beginning in the fourth quarter. Sales in the first quarter of 2015 are expected to be 10% higher than the budgeted sales for the first quarter of 2014. Production. Management desires to maintain the ending finished goods inventories at 25% of the next quarter's budgeted sales volume. Prepare the sales and production budgets by quarters for the year ending December 31, 2014.arrow_forward
- Regal Furnitures produces and sells high-quality reading tables. One of the very popular models in the reading table lineup is RT360. The management accountant of the company is in the process of preparing its Selling and Administrative Expense Budget for the first quarter of the year. The following budget data are available: Assume that all of these expenses (except depreciation) are paid in cash in the month they are incurred. Answer the following questions:a) If Regal Furnitures has budgeted to sell 19,000 RT360 tables in January, then what will be the total budgeted selling and administrative expenses for January?b) If the company has budgeted to sell 16,000 RT360 tables in February, then what will be the budgeted total cash disbursements for selling and administrative expenses for February?c) If the budgeted total cash disbursements for selling and administrative expenses for March total Tk. 459,200, then how many RT360 table does the company plan to sell in March?arrow_forwardPeninsula Candy Company makes three types of candy bars: Chewy, Chunky, and Choco-Lite (Lite). Sales volume for the annual budget is determined by estimating the total market volume for candy bars and then applying the company's prior year market share, adjusted for planned changes due to company programs for the coming year. Volume is apportioned among the three bars based on the prior year's product mix, again adjusted for planned changes for the coming year. The following are the company budget and the results of operations for July. Budget Chewy Chunky Choco-Lite Total Sales-units (in thousands) 2,000 bars 2,000 bars 4,000 bars 8,000 bars Sales-dollars (in thousands) $ 240 $ 360 $ 720 $ 1,320 Variable costs 180 300 560 1,040 Contribution margin $ 60 $ 60 $ 160 $ 280 Manufacturing fixed cost 40 38 60 138 Product margin $ 20 $ 22 $ 100 $ 142 Marketing and…arrow_forwardPeninsula Candy Company makes three types of candy bars: Chewy, Chunky, and Choco-Lite (Lite). Sales volume for the annual budget is determined by estimating the total market volume for candy bars and then applying the company's prior year market share, adjusted for planned changes due to company programs for the coming year. Volume is apportioned among the three bars based on the prior year's product mix, again adjusted for planned changes for the coming year. The following are the company budget and the results of operations for July. Budget Sales-units (in thousands) Sales-dollars (in thousands) Chewy 2,000 bars $200 Chunky 2,000 bars $400 Choco-Lite Total 8,000 bars $1, 200 4,000 bars $600 Variable costs 140 320 460 920 Contribution margin Manufacturing fixed cost $ 60 $ 80 $140 280 40 40 60 140 Product margin $ 20 $ 40 $ 80 $4 140 Marketing and administrative costs (all fixed) 50 Operating profit $ 90 Actual Sales-units (in thousands) Sales-dollars (in thousands) Variable costs…arrow_forward
- Bramble Corp. prepared a 2022 budget for 228000 units of product. Actual production in 2022 was 160000 units. To be most useful, what amounts should a performance report for this company compare? The actual results for 160000 units with the original budget for 228000 units. The actual results for 160000 units with a new budget for 160000 units. The actual results for 160000 units with last year's actual results for 167600 units. O All of these comparisons are equally useful.arrow_forwardKirkland Company combines its operating expenses for budget purposes in a selling and administrative expense budget. For the first 6 months of 2017, the following data are available. 1. Sales: 20,800 units quarter 1; 22,100 units quarter 2. 2. Variable costs per dollar of sales: sales commissions 5%, delivery expense 2%, and advertising 3%. 3. Fixed costs per quarter: sales salaries $10,900, office salaries $6,160, depreciation $4,490, insurance $2,080, utilities $880, and repairs expense $670. 4. Unit selling price: $24. Prepare a selling and administrative expense budget by quarters for the first 6 months of 2017. KIRKLAND COMPANY Selling and Administrative Expense Budget For the Six Months Ending June 30, 2017 : Quarter Budgeted Sales in Units Variable Expenses Sales Commissions Delivery Expense Advertising Total Variable Fixed Expenses Sales Salaries Office Salaries Depreciation Insurance Utilities Repairs Expense Total Fixed 3 Selling and Administrative Expenses • Six Months 300…arrow_forwardFarooq Company has accumulated the following budget data for the year 2020. Sales: 60,000 units, unit selling price $80. Cost of one unit of finished goods: Direct materials 3 pounds at $5 per pound, direct labor 3 hours at $6 per hour, and manufacturing overhead $7 per direct labor hour. Selling and administrative expenses: $750,000. Income taxes: 30% of income before income taxes. Instructions Prepare a schedule showing the computation of cost of goods sold for 2020. Prepare a budgeted income statement for 2020.arrow_forward
- Kirkland Company combines its operating expenses for budget purposes in a selling and administrative expense budget. For the first 6 months of 2020, the following data are available. Sales: 20,500 units quarter 1: 22.200 units quarter 2 Variable costs per dollar of sales: sales commissions 5%, delivery expense 2%, and advertising 3% Fixed costs per quarter: sales salaries $10,500, office salaries $6,250, depreciation $4,340, insurance $2,000, utilities $860, and repairs expense $690. 4. Unit selling price: $24. 1. 2 3. Prepare a selling and administrative expense budget by quarters for the first 6 months of 2020. (List variable expenses before fixed expense)arrow_forwardChris Jackson was recently promoted to Controller ofResearch and Development (R&D) for BrisCor, a Fortune 500 pharmaceutical company that manufacturesprescription drugs and nutritional supplements. The company’s total R&D cost for 2017 was expected (budgeted)to be $5 billion. During the company’s midyear budget review, Chris realized that current R&D expenditureswere already at $3.5 billion, nearly 40% above the midyear target. At this current rate of expenditure,the R&D division was on track to exceed its total year-end budget by $2 billion!In a meeting with CFO Ronald Meece later that day, Jackson delivered the bad news. Meece was bothshocked and outraged that the R&D spending had gotten out of control. Meece wasn’t any more understandingwhen Jackson revealed that the excess cost was entirely related to research and development of anew drug, Vyacon, which was expected to go to market next year. The new drug would result in large profitsfor BrisCor, if the product…arrow_forwardParlex Company combines its operating expenses for budget purposes in a selling and administrative expense budget. For the first 6 months of 2019, the following data are available. . Sales: 20,000 units quarter 1; 22,000 units quarter 2. Variable costs per dollar of sales: sales commissions 5%, delivery expense 2%, and advertising 4%. Fixed costs per quarter: sales salaries $10,000, office salaries $8,000, depreciation $4,200, insurance $1,500, utilities $800, and repairs expense $500. Unit selling price: $20. Instructions: Prepare a selling and administrative expense budget by quarters for the first 6 months of 2019.arrow_forward
 Cornerstones of Cost Management (Cornerstones Ser...AccountingISBN:9781305970663Author:Don R. Hansen, Maryanne M. MowenPublisher:Cengage Learning