
a)
To estimate: The regression equation.
Introduction:
a)
Explanation of Solution
Data:
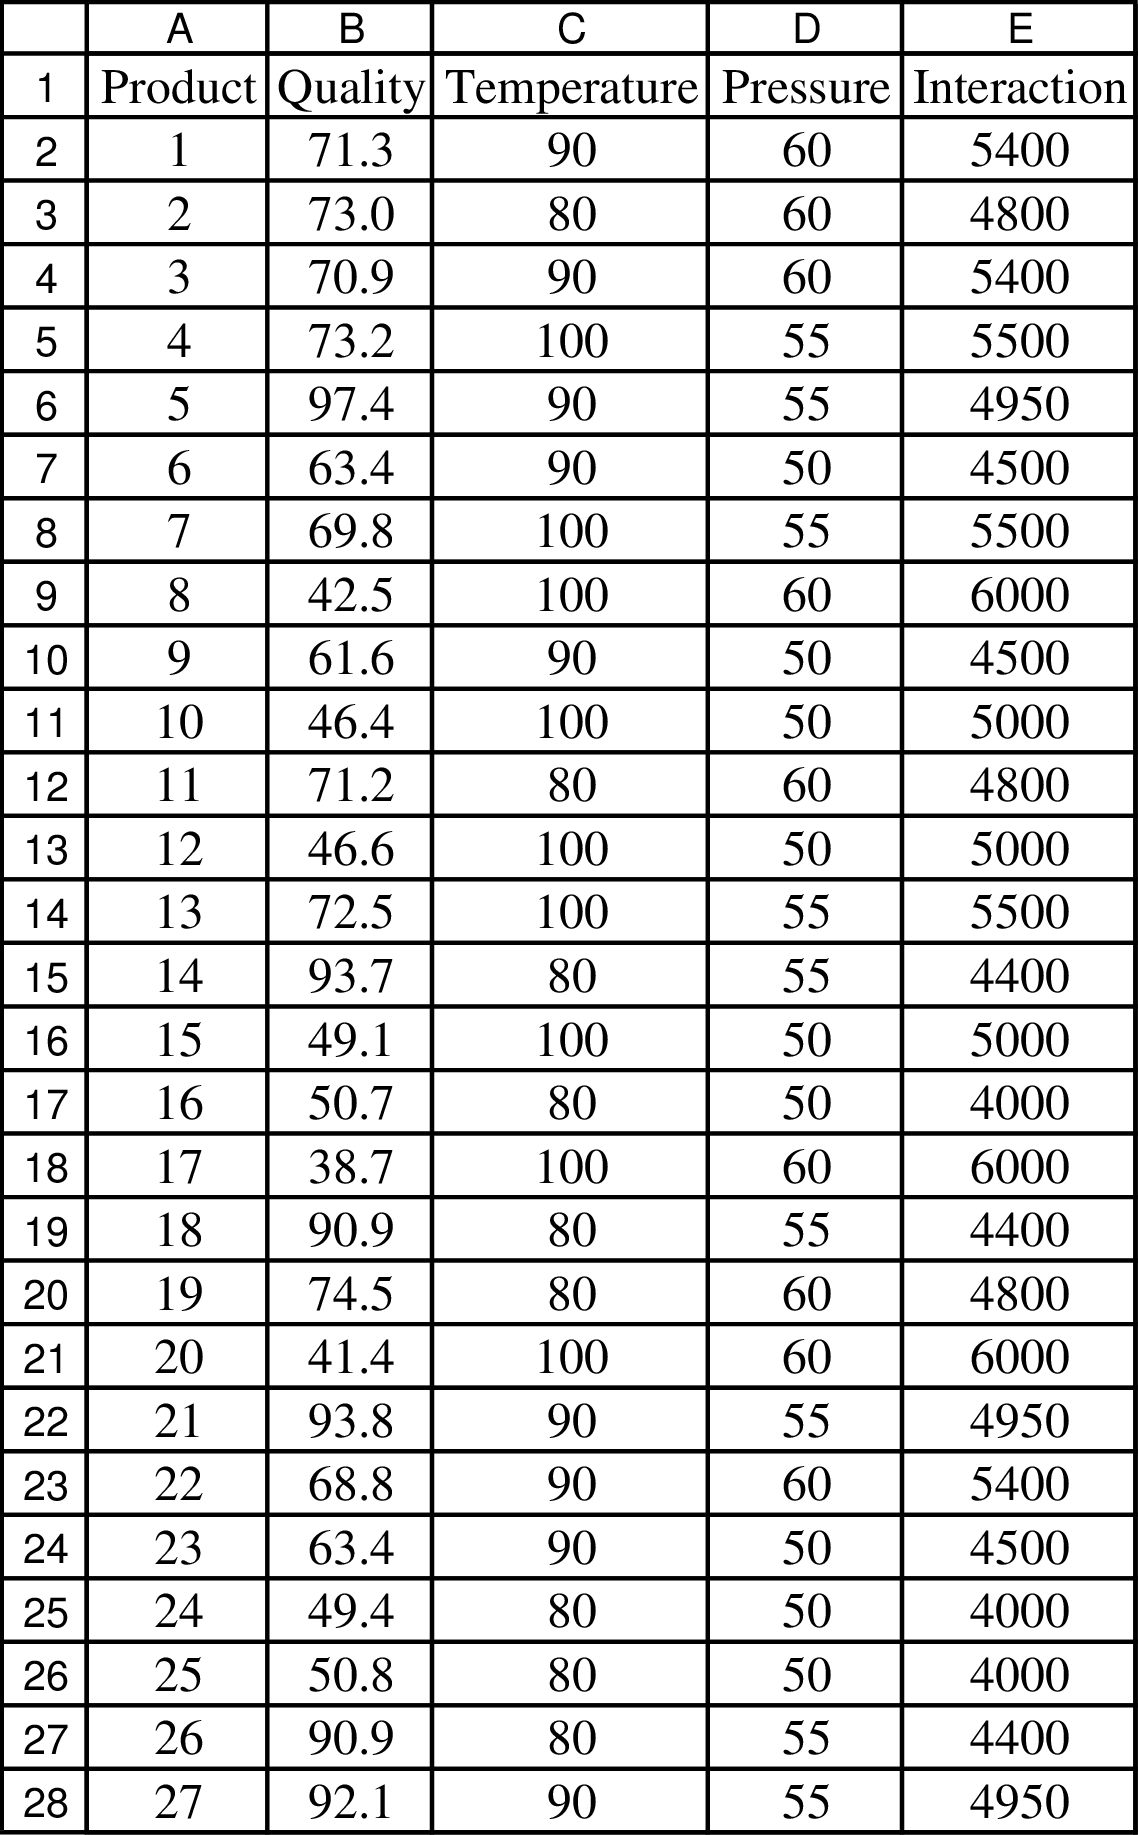
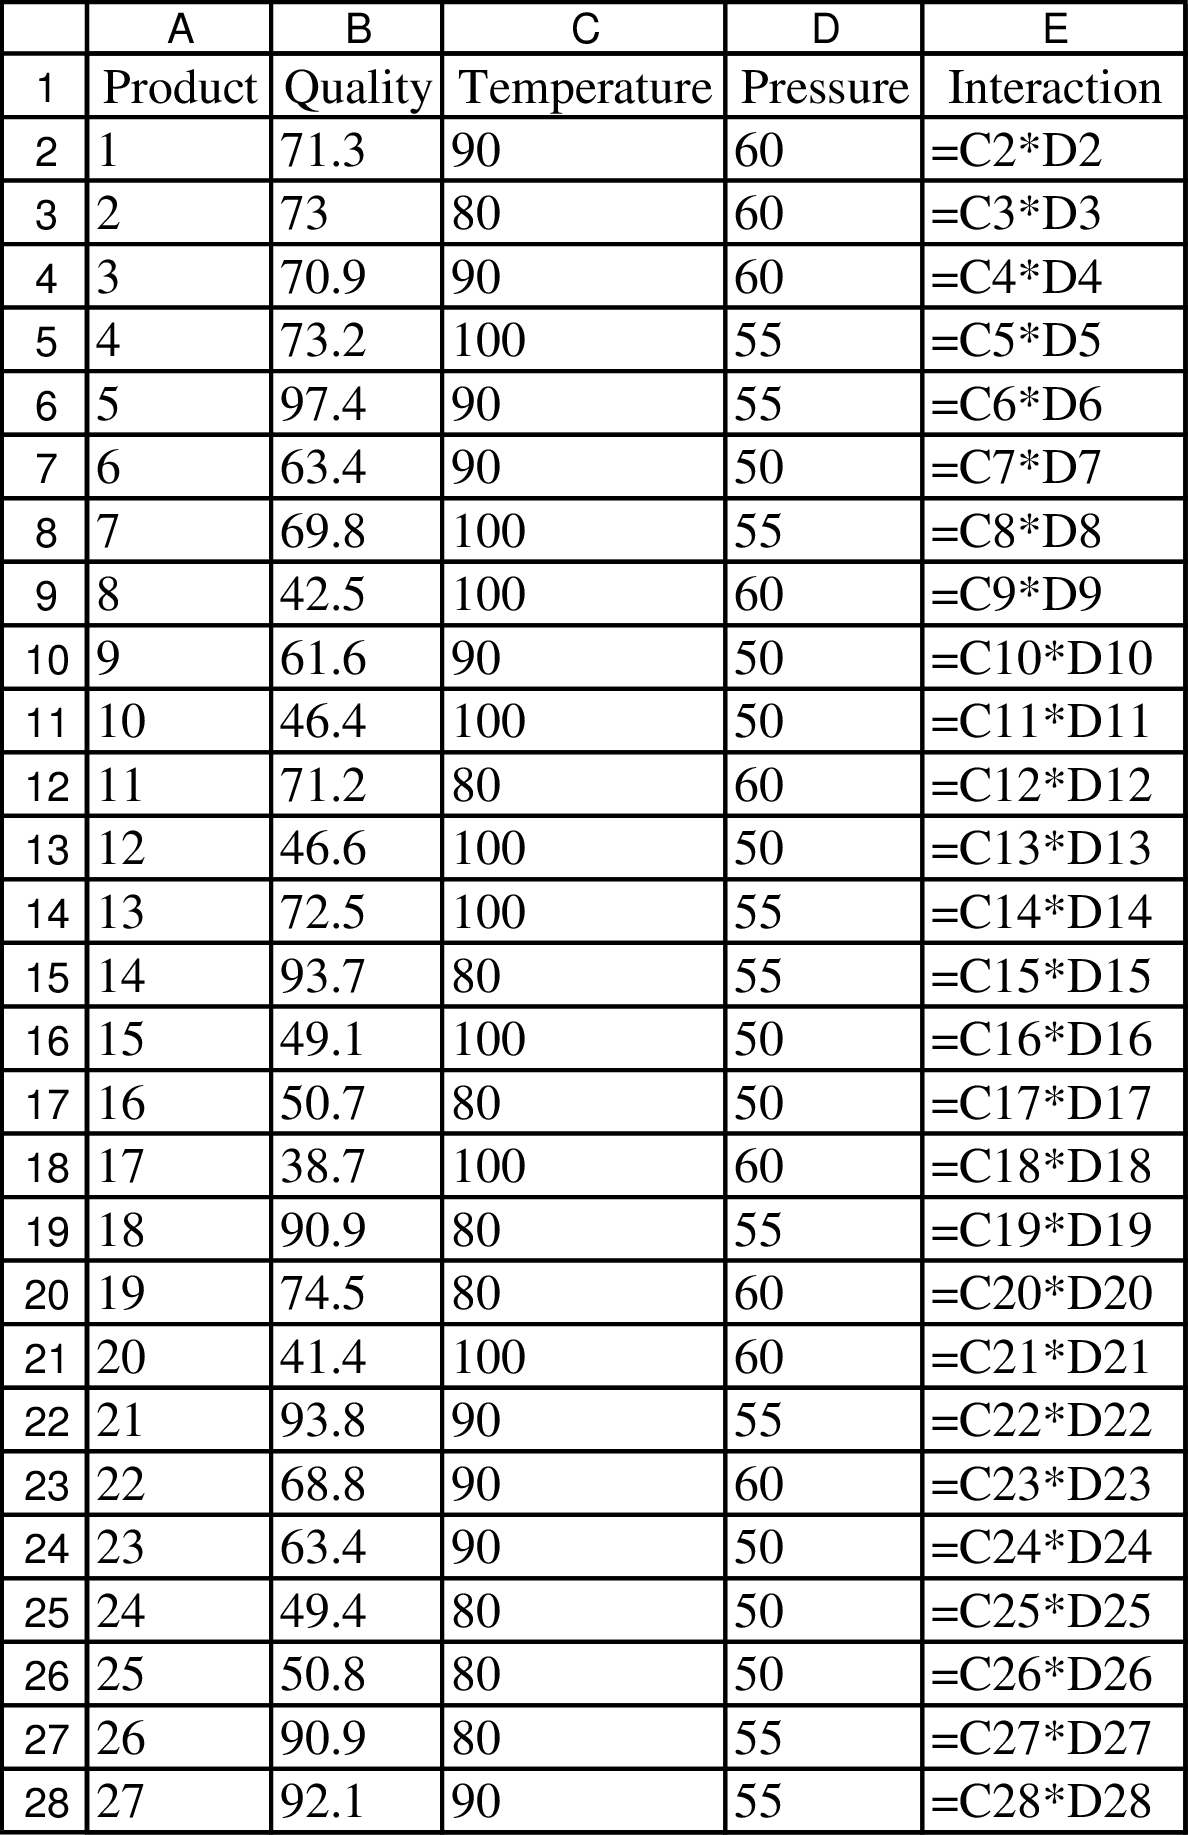
Formulae to determine the data:
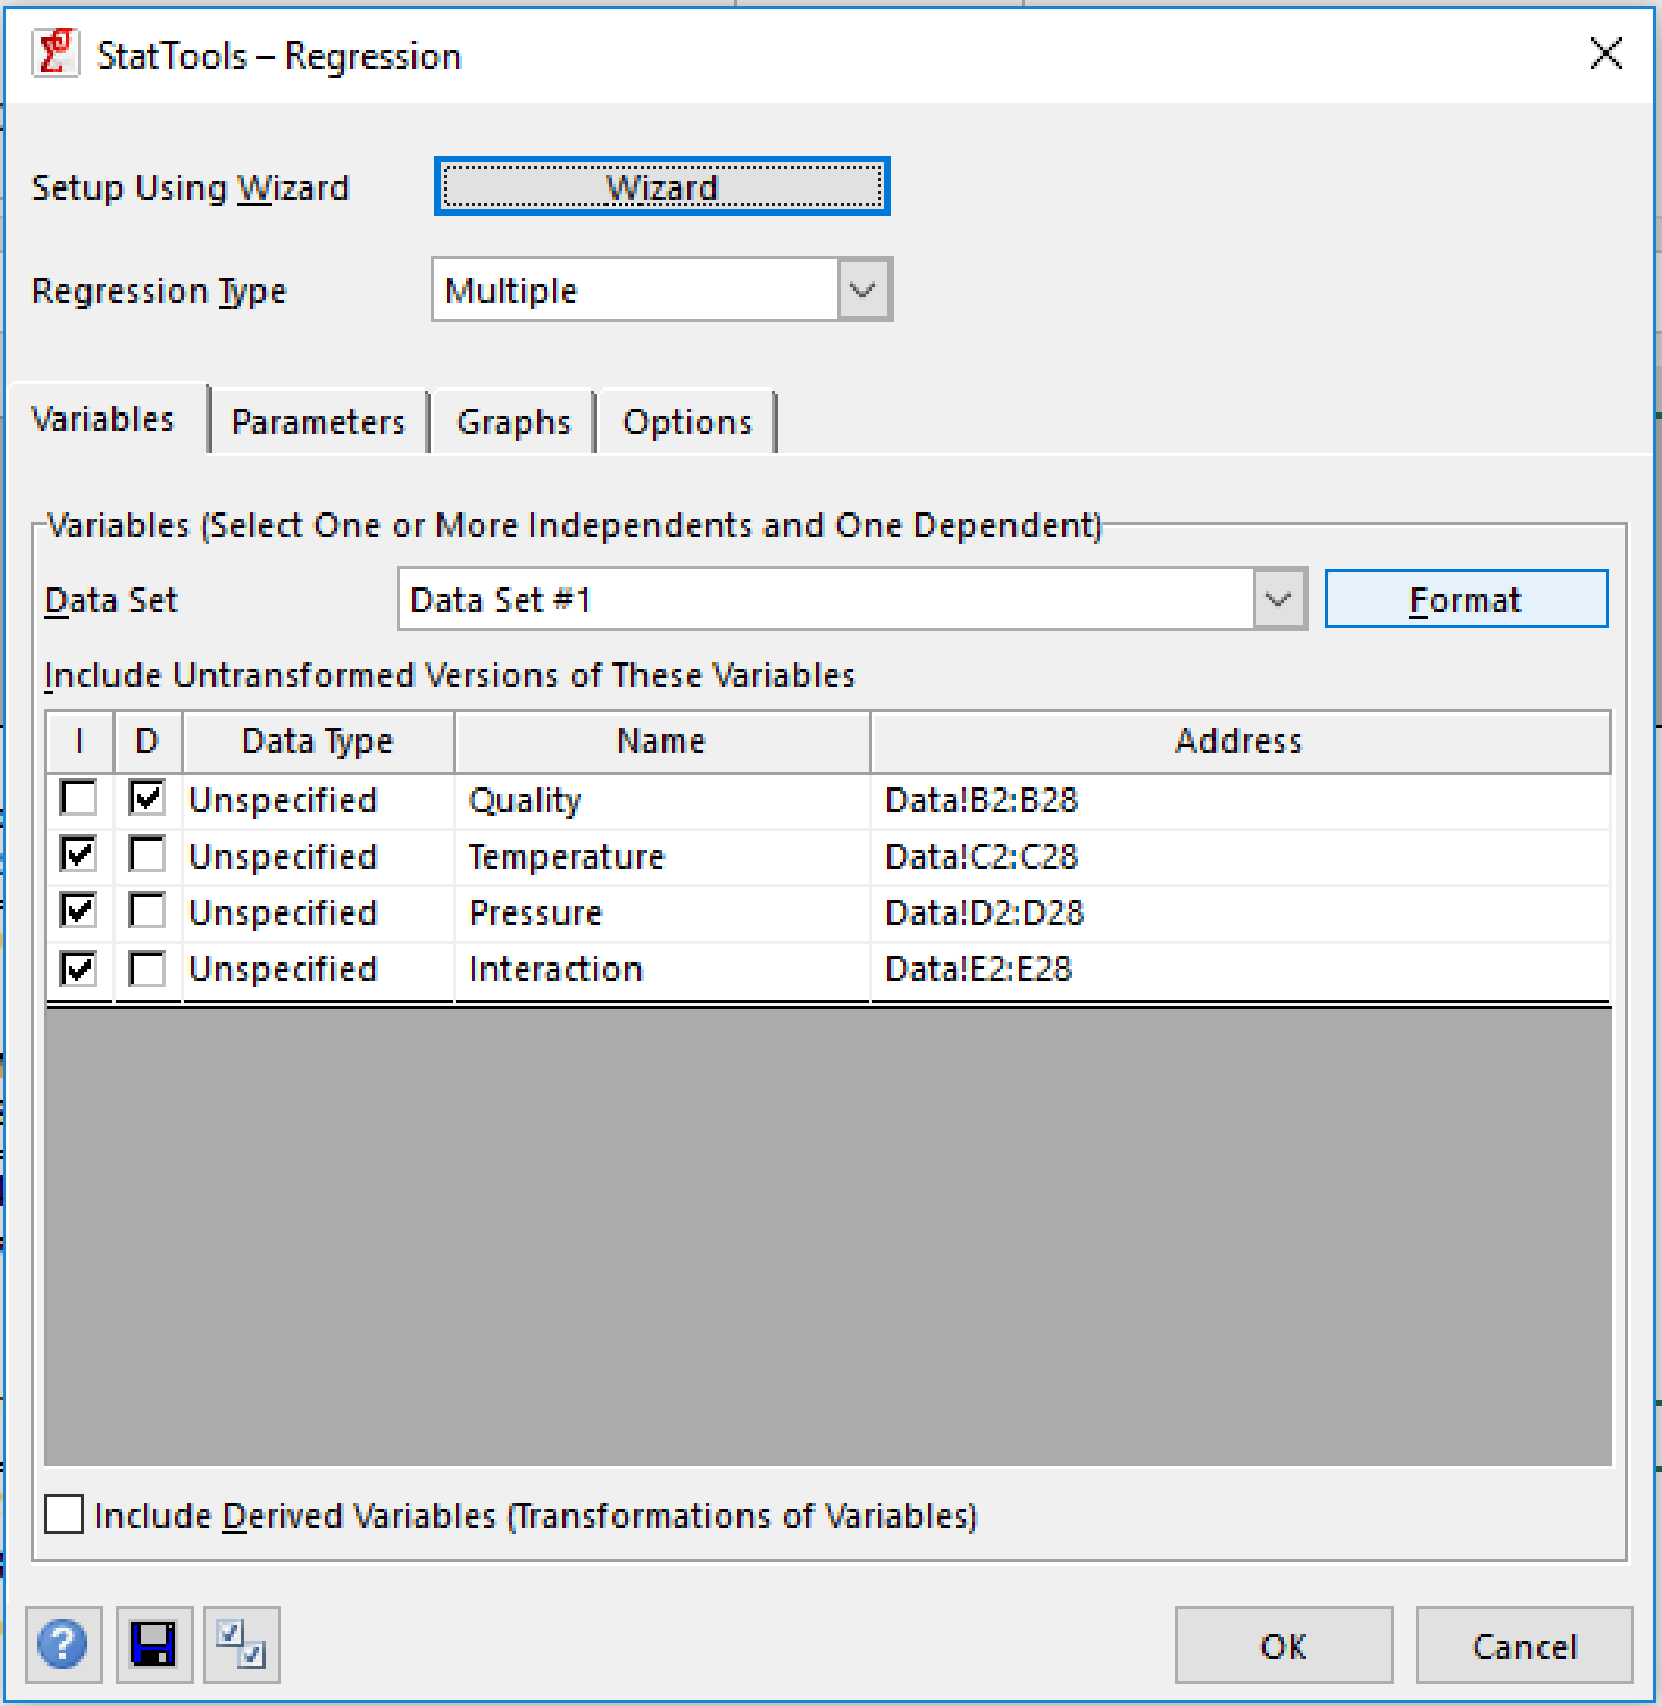
Regression using StatTools:
Regression and classification from the StatTools should be used. The below image shows the regression parameter table from StatTools:

Regression result:
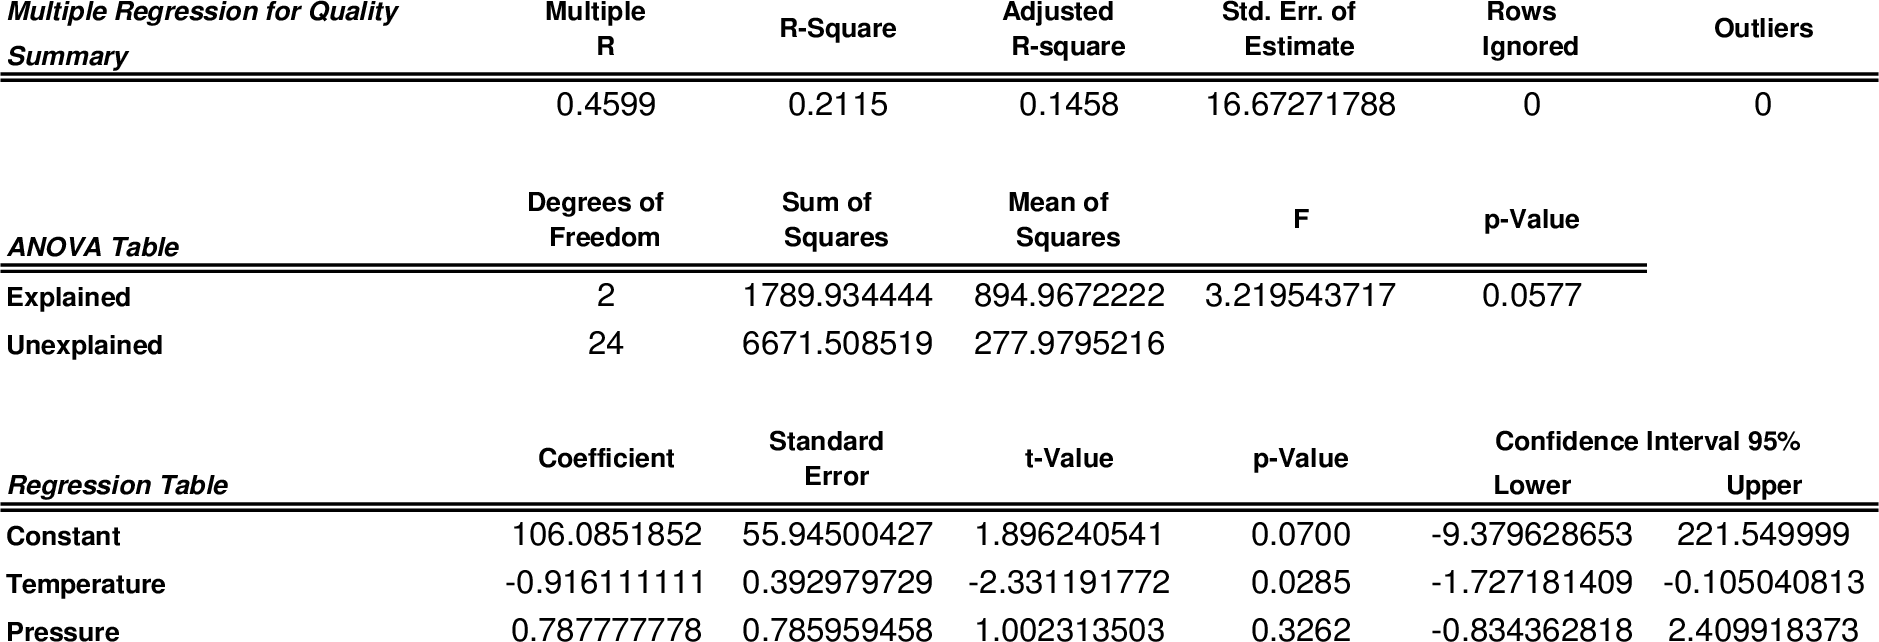
Hence, the regression equation is Quality = 106.085 – 0.916 temperature + 0.788 pressure. The value of R-square is 0.2115. The quality score falls by 0.916 and the pressure would remain constant when the temperature increases by one degree. The quality score rises by 0.788 and the temperature would remain constant when the pressure increases by one pound.
b)
To run: The regression by adding an interaction term between pressure and temperature.
Introduction: Forecasting is a technique of predicting future events based on historical data and projecting them into the future with a mathematical model. Forecasting may be an intuitive or subjective prediction.
b)
Explanation of Solution
Data:

Formulae to determine the data:

Regression using StatTools:
Regression and classification from the StatTools should be used. The below image shows the regression parameter table from StatTools:
Regression result:
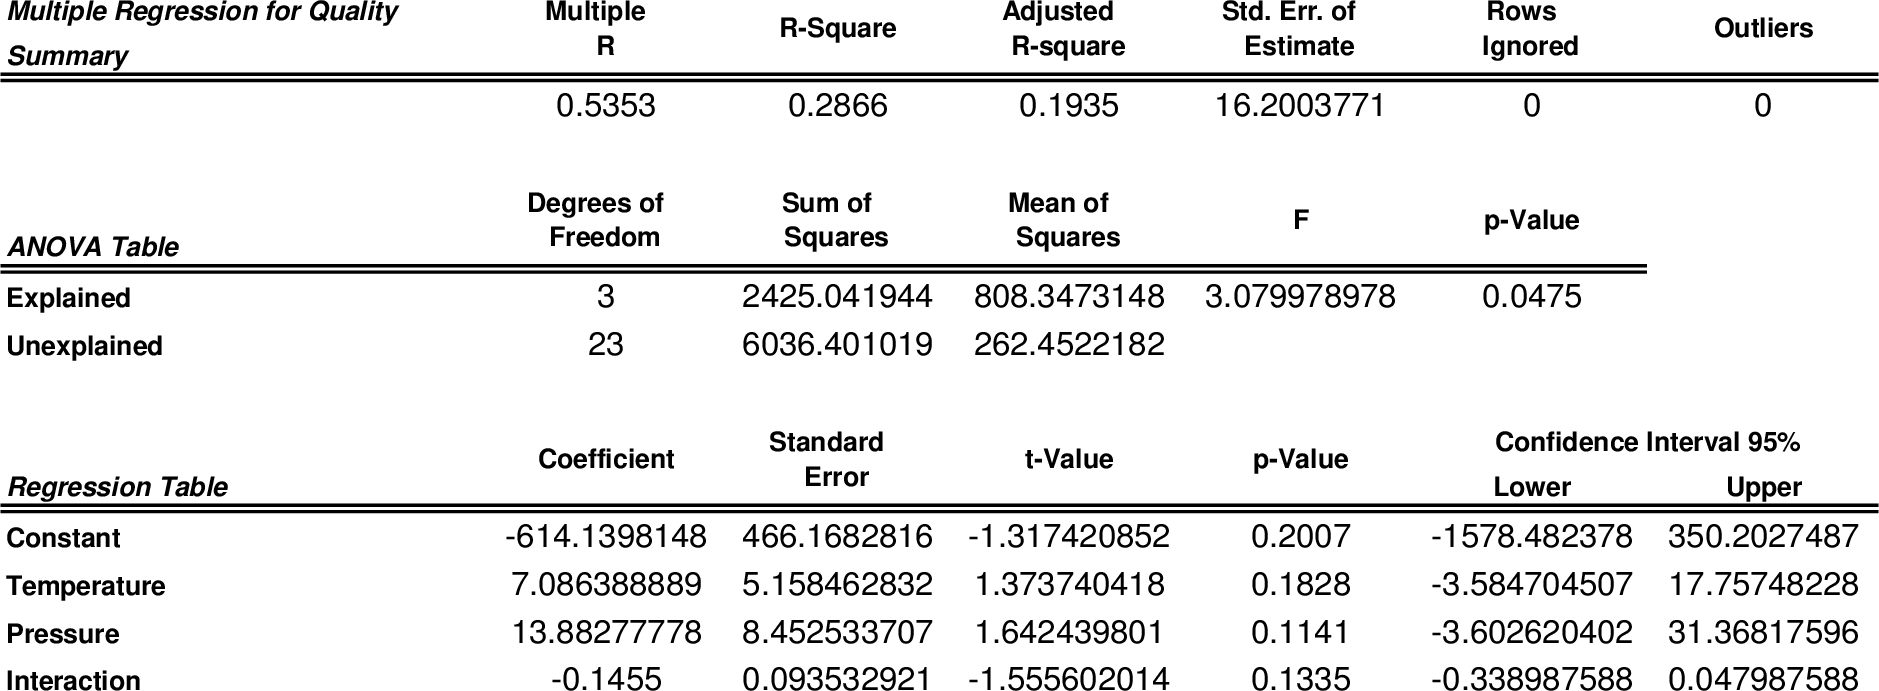
The above table provides the estimated coefficients. The standard error of estimate falls and the adjusted R-square rises.
c)
To determine: The difference between the estimated coefficients in the two equations.
Introduction: Forecasting is a technique of predicting future events based on historical data and projecting them into the future with a mathematical model. Forecasting may be an intuitive or subjective prediction.
c)
Explanation of Solution
The quality score would increase by 7.086 – 0.145×pressure and the pressure would remain constant when the temperature increases by one degree. The quality score would increase by 13.883 – 0.145×temperature and the temperature would remain constant when the pressure increases by one pound per square inch. Based on the level of the pressure, the coefficient would indicate the quality change rate with respect to the temperature.
Want to see more full solutions like this?
Chapter 14 Solutions
Practical Management Science, Loose-leaf Version

- The file P02_41.xlsx contains the cumulative number of bits (in trillions) of DRAM (a type of computer memory) produced and the price per bit (in thousandth of a cent). a. Fit a power curve that can be used to show how price per bit drops with increased production. This relationship is known as the learning curve. b. Suppose the cumulative number of bits doubles. Create a prediction for the price per bit. Does the change in the price per bit depend on the current price?arrow_forwardUse the RAND function and the Copy command to generate 100 random numbers. a. What fraction of the random numbers are smaller than 0.5? b. What fraction of the time is a random number less than 0.5 followed by a random number greater than 0.5? c. What fraction of the random numbers are larger than 0.8? d. Freeze these random numbers. However, instead of pasting them over the original random numbers, paste them onto a new range. Then press the F9 recalculate key. The original random numbers should change, but the pasted copy should remain the same.arrow_forwardSuppose you have invested 25% of your portfolio in four different stocks. The mean and standard deviation of the annual return on each stock are shown in the file P11_46.xlsx. The correlations between the annual returns on the four stocks are also shown in this file. a. What is the probability that your portfolios annual return will exceed 30%? b. What is the probability that your portfolio will lose money during the year?arrow_forward
 Practical Management ScienceOperations ManagementISBN:9781337406659Author:WINSTON, Wayne L.Publisher:Cengage,