
Introduction To Statistics And Data Analysis
6th Edition
ISBN: 9781337793612
Author: PECK, Roxy.
Publisher: Cengage Learning,
expand_more
expand_more
format_list_bulleted
Concept explainers
Videos
Textbook Question
Chapter 1.4, Problem 29E
The report “Trends m Community Colleges” (collegeboard.com/trends April 2106, trends .collegeboard.org/sites/default/files/trends-in-community-colleges-research-brief.pdf, retreived February 8, 2018) included the accompanying information on student debt for students graduating with an AA degree from a public community college in 2012.
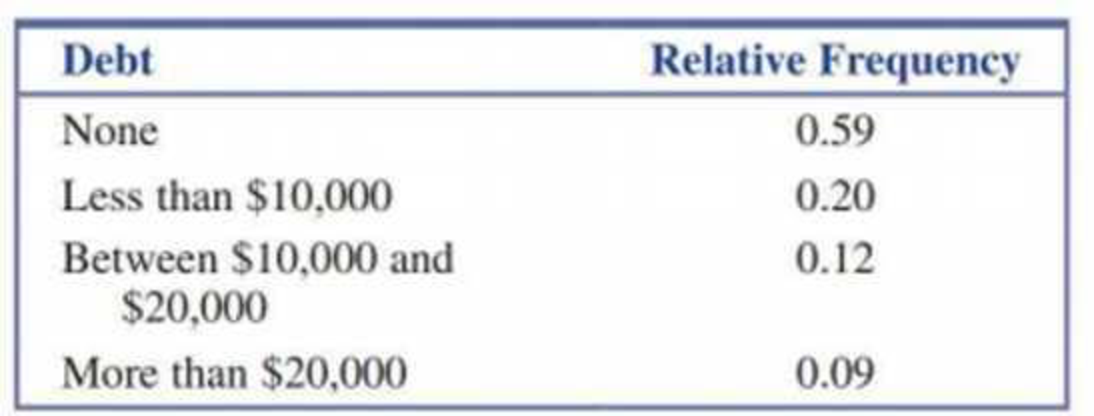
- a. Use the given information to construct a bar chart.
- b. Write a few sentences commenting on student debt for public community college graduates.
Expert Solution & Answer
Want to see the full answer?
Check out a sample textbook solution
Students have asked these similar questions
Your electronic files, including both excel and word files, must be submitted. Please use a separate
worksheet in excel for each question and label them respectively. Please type the section number of
your class, name and ID of the team members on the file.
1. Researchers wanted to understand college students' usage of time. A formal survey of 3,000 students was
taken and the results are summarized as follows:
Activity
Attending class
Sleeping
Socializing & recreation
Studying
Working, volunteering, student clubs
Percentage (%)
a) Construct a bar chart, a pie chart, and a Pareto chart.
b) What conclusions can you reach concerning what college students do with their time?
ii.
iii.
iv.
9
24
51
7
9
2. Examine the data in the file "Class survey data.xls" posted in the week 5 of course portal.
a) Create a descriptive statistics summary table using Data Analysis Toolpak (Add in for Excel) for
survey questions 2 through 10 inclusive.
b)
Identify the data types of each of the 9 variables as…
Draw the correct bar graph of obesity rates for Maine, Florida, Mississippi, Colorado, and Wisconsin. Would you please explain for understanding?
Official unemployment rates for the U.S. population are reportedon a monthly basis by the Bureau of Labor Statistics.For the period October, 2011, through January, 2012, theofficial unemployment rates were 8.9% (Oct.), 8.7% (Nov.),8.5% (Dec.), and 8.3% (Jan.). (Source: U.S. Bureau of LaborStatistics, www.bls.gov.) If the unemployment rateswere to continue to decrease following a linear model,(a) predict the unemployment rate on January, 2013.(b) predict when the United States would reach a zero unemploymentrate.
Chapter 1 Solutions
Introduction To Statistics And Data Analysis
Ch. 1.3 - Give brief definitions of the terms descriptive...Ch. 1.3 - Give brief definitions of the terms population and...Ch. 1.3 - The following conclusion from a study appeared in...Ch. 1.3 - Based on a study of 2 121 children between the...Ch. 1.3 - The student senate at a university with 15,000...Ch. 1.3 - The National Retail Federation used data from a...Ch. 1.3 - The supervisors of a rural county are interested...Ch. 1.3 - A consumer group conducts crash tests of new model...Ch. 1.3 - A building contractor has a chance to buy an odd...Ch. 1.3 - The article Brain Shunt Tested to Treat Alzheimers...
Ch. 1.3 - In a study of whether taking a garlic supplement...Ch. 1.4 - Classify each of the following variables as either...Ch. 1.4 - Classify each of the following variables as either...Ch. 1.4 - For the following numerical variables, state...Ch. 1.4 - For the following numerical variables, state...Ch. 1.4 - For each of the following situations, give a set...Ch. 1.4 - In a survey of 100 people who had recently...Ch. 1.4 - The Gallup report More Americans Say Real Estate...Ch. 1.4 - An article in the New Times San Luis Obispo...Ch. 1.4 - Box Office Mojo (boxofficemojo.com) tracks movie...Ch. 1.4 - The report With Their Whole Lives Ahead of Them...Ch. 1.4 - The following display is a graph similar to one...Ch. 1.4 - The accompanying table gives the total number...Ch. 1.4 - Heal the Bay is an environmental organization that...Ch. 1.4 - The report referenced in the previous exercise...Ch. 1.4 - The U.S. Department of Health and Human Services...Ch. 1.4 - Example 1.5 gave the accompanying data on violent...Ch. 1.4 - The article Fliers Trapped on Tarmac Push for...Ch. 1.4 - The report Trends m Community Colleges...Ch. 1.4 - The article Where College Students Buy Textbooks...Ch. 1.4 - Prob. 31ECh. 1.4 - In the United States, movies are rated by the...Ch. 1 - The report Testing the Waters 2009 (nrdc.org)...Ch. 1 - The U.S. Department of Education reported that 14%...Ch. 1 - The Computer Assisted Assessment Center at the...Ch. 1 - The article Just How Safe Is That Jet? (USA TODAY,...Ch. 1 - Each year, U.S. News and World Report publishes a...Ch. 1 - Many adolescent boys aspire to be professional...
Knowledge Booster


Learn more about
Need a deep-dive on the concept behind this application? Look no further. Learn more about this topic, statistics and related others by exploring similar questions and additional content below.Similar questions
- In 2011 home prices and mortgage rates dropped so low that in a number of cities the monthly cost of owning a home was less expensive than renting. The following data show the average asking rent for 10 markets and the monthly mortgage on the median priced home (including taxes and insurance) for 10 cities where the average monthly mortgage payment was less than the average asking rent (The Wall Street Journal, November 26–27, 2011).Click on the datafile logo to reference the data. Enter negative values as negative numbers. a. Develop the estimated regression equation that can be used to predict the monthly mortgage given the average asking rent (to 2 decimals).The regression equation is:Mortgage ($) = + Rent ($)arrow_forwardThe results of a search to find the least expensive round-trip flights to Atlanta and Salt Lake C major U.S. cities are shown in the following table. The departure date was June 20, 2012 and was June 27, 2012. Click on the datafile logo to reference the data, DATA file Round-Trip Cost ($) Departure City Atlanta Salt Lake Cit Cincinnati New York 340.10 321.60 291.60 570.10 354.60 465.60 Chicago Dae 210/Oarrow_forwardStays in Europe and the Mediterranean. The Bureau of Economic Analysis gathers information on the length of stay in Europe and the Mediterranean by U.S. travelers. Data are published in Survey of Current Business. The following stem-and-leaf diagram portrays the length of stay, in days, of a sample of 36 U.S. residents who traveled to Europe and the Mediterranean last year.arrow_forward
- Define the term scatterplot?arrow_forwardIn 2011, home prices and mortgage rates fell so far that in a number of cities the monthly cost of owning a home was less expensive than renting. The following data show the average asking rent and the monthly mortgage on the median-priced home (including taxes and insurance) for 10 cities where the average monthly mortgage payment was less than the average asking rent (The Wall Street Journal, November 26–27, 2011). 7. City Rent ($) Mortgage ($) Atlanta 840 539 1062 1002 Chicago Detroit 823 626 DATA file Jacksonville, Fla. Las Vegas 779 711 796 655 RentMortgage 1071 953 Miami 977 Minneapolis Orlando, Fla. 776 851 695 762 651 654 Phoenix St. Louis 723 Develop a scatter diagram for these data, treating the average asking rent as the inde- pendent variable. Does a simple linear regression model appear to be appropriate? b. Use a simple linear regression model to develop an estimated regression equation to predict the monthly mortgage on the median-priced home given the average asking…arrow_forwardAS2. NO9. DATA ANALYSISarrow_forward
- Construct a typology of pro-life attitudesarrow_forwardIn 2010, the U.S. Congress passed the historic health care reform bill that will provide some type of coverage for the 32 million Americans currently without health care insurance. Just how widespread is the lack of medical coverage? The media claim that the segments of the population most at risk for disease and thus needing healthcare are women, children, the elderly and the poor. The following tables were generated from the U.S. Census Bureau, Current Population Survey, Annual Social and Economic Supplement (2011). The tables report the number of uninsured (in thousands) by sex, by age, and by household income. Is being insured or not dependent on gender? Fill in the degrees of freedom and p-value in the output below and draw a clear conclusion indicating which gender is more at risk of not being insured if there is a significant difference.arrow_forwardEach week the Wall Street Journal and Harris Interactive track the opinions and experiences of college recruiters for large corporations and summarize the results in the Business School Survey. Data have been gathered for the top 10 business schools from a list of 76 and is summarized below. Please complete the questions below and upload this document and your EXCEL document to the portal in CANVAS. School Ranking Enrollment (# of full-time students) Annual Tuition ($) Mean GMAT % with Job Offer Average Salary ($) Dartmouth 1 503 38,400 704 89 119,800 Michigan 2 1873 33,076 690 91 105,986 Carnegie Mellon 3 661 38,800 691 93 95,531 Northwestern 4 2650 38,844 700 94 117,060 Yale 5 468 36,800 696 86 104,018 Pennsylvania 6 1840 40,458 716 92 117,471 California Berkeley 7 1281 21,512 701 92 112,699 Columbia 8 1796 38,290 709 95 126,319 North…arrow_forward
- In 2010, the U.S. Congress passed the historic health care reform bill that will provide some type of coverage for the 32 million Americans currently without health care insurance. Just how widespread is the lack of medical coverage? The media claim that the segments of the population most at risk for disease and thus needing healthcare are women, children, the elderly and the poor. The following tables were generated from the U.S. Census Bureau, Current Population Survey, Annual Social and Economic Supplement (2011). The tables report the number of uninsured (in thousands) by sex, by age, and by household income Is being insured or not dependent on the age groups identified in the analysis? Fill in the degrees of freedom and p-value in the output below and draw a clear conclusion indicating which age-groups are more at risk of not being insured if there is a significant relationshiparrow_forwardIn 2010, the U.S. Congress passed the historic health care reform bill that will provide some type of coverage for the 32 million Americans currently without health care insurance. Just how widespread is the lack of medical coverage? The media claim that the segments of the population most at risk for disease and thus needing healthcare are women, children, the elderly and the poor. The following tables were generated from the U.S. Census Bureau, Current Population Survey, Annual Social and Economic Supplement (2011). The tables report the number of uninsured (in thousands) by sex, by age, and by household income Is being insured or not dependent on the income groups identified in the analysis? Fill in the degrees of freedom and p-value in the output below and draw a clear conclusion indicating which income-groups are more at risk of not being insured if there is a significant relationship.arrow_forwardIn 2010, the U.S. Congress passed the historic health care reform bill that will provide some type of coverage for the 32 million Americans currently without health care insurance. Just how widespread is the lack of medical coverage? The media claim that the segments of the population most at risk for disease and thus needing healthcare are women, children, the elderly and the poor. The following tables were generated from the U.S. Census Bureau, Current Population Survey, Annual Social and Economic Supplement (2011). Explain using supportive arguments from your analyses. Write a general summary paragraph identifying groups lacking in coverage by gender, age and income and commenting on the headline. Reference the observed numbers and percentages in your summary paragraph to see how the groups trend in identifying potentially more at-risk. Analysises for reference: Is being insured or not dependent on gender? Fill in the degrees of freedom and p-value in the output below and draw…arrow_forward
arrow_back_ios
SEE MORE QUESTIONS
arrow_forward_ios
Recommended textbooks for you
 Glencoe Algebra 1, Student Edition, 9780079039897...AlgebraISBN:9780079039897Author:CarterPublisher:McGraw Hill
Glencoe Algebra 1, Student Edition, 9780079039897...
Algebra
ISBN:9780079039897
Author:Carter
Publisher:McGraw Hill
Which is the best chart: Selecting among 14 types of charts Part II; Author: 365 Data Science;https://www.youtube.com/watch?v=qGaIB-bRn-A;License: Standard YouTube License, CC-BY