Videos
1(a)
Financial Ratios: Financial ratios are the metrics used to evaluate the liquidity, capabilities, profitability, and overall performance of a company.
To determine: Return on total assets for five years (20Y4 to 20Y8)
Explanation of Solution
Return on assets determines the particular company’s overall earning power. It is determined by dividing sum of net income and interest expense and average total assets.
Formula:
1(b)
To determine: Return on
1(b)
Explanation of Solution
Formula:
1(c)
To determine: Times interest earned ratio for five years
1(c)
Explanation of Solution
Times interest earned ratio quantifies the number of times the earnings before interest and taxes can pay the interest expense. First, determine the sum of income before income tax and interest expense. Then, divide the sum by interest expense.
Formula:
1(d)
To determine: Ratio of liabilities to stockholders’ equity for five years (20Y4 to 20Y8)
1(d)
Explanation of Solution
Ratio of liabilities to stockholders’ equity is determined by dividing liabilities and stockholders’ equity. Liabilities are determined as the difference between ending balance of assets and stockholders’ equity.
Formula:
To Display: The determined ratios in a graph
Explanation of Solution
Return on total assets
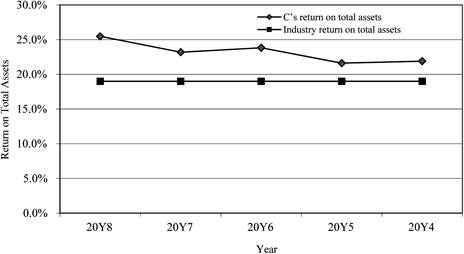
Figure (1)
Return on stockholders’ equity
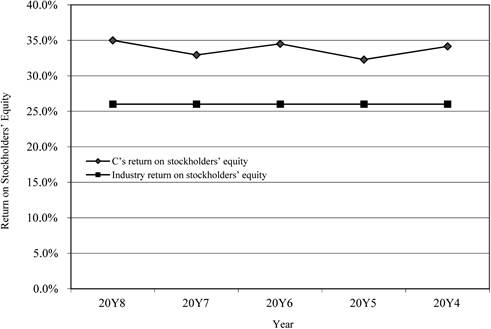
Figure (2)
Times interest earned ratio
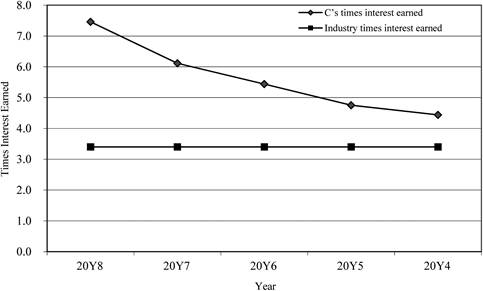
Figure (3)
Ratio of liabilities to stockholders’ equity
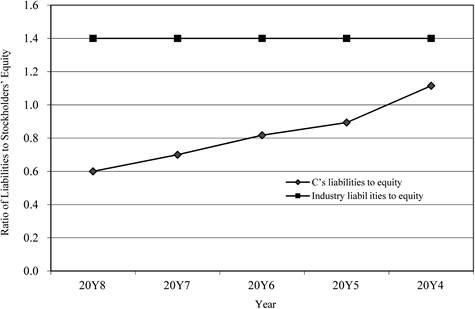
Figure (4)
2.
To prepare: Analysis of graphs
2.
Explanation of Solution
- The return on total assets and return on stockholders’ equity are in increasing trend for the last five years. There is a positive use of leverage. It is evident through the above ratios.
- The ratio of liabilities to stockholders’ equity shows that the proportion of debt to stockholders’ equity is declining over the period.
- The level of debt has been relative to the equity and has improved in the five years.
- The times interest earned ratio is improving
- g when compared to industry average.
Want to see more full solutions like this?
Chapter 14 Solutions
CengageNOWv2, 2 terms Printed Access Card for Warren/Reeve/Duchac’s Financial & Managerial Accounting, 14th


- Juroe Company provided the following income statement for last year: Juroes balance sheet as of December 31 last year showed total liabilities of 10,250,000, total equity of 6,150,000, and total assets of 16,400,000. Required: 1. Calculate the return on sales. (Note: Round the percent to two decimal places.) 2. CONCEPTUAL CONNECTION Briefly explain the meaning of the return on sales ratio, and comment on whether Juroes return on sales ratio appears appropriate.arrow_forwardAddai Company has provided the following comparative information: You have been asked to evaluate the historical performance of the company over the last five years. Selected industry ratios have remained relatively steady at the following levels for the last five years:2010-2014Rate earned on total assets ........28%Rate earned on stockholders' equity .....18%Number of times interest charges are earned. 2.7Ratio of liabilities to stockholders' equity... 0.4Instructions1. Prepare four line graphs with the ratio on the vertical axis and the years on the horizontal axis for the following four ratios (rounded to one decimal place):a. Rate earned on total assetsb. Rate earned on stockholders' equityc. Number of times interest charges are earnedd. Ratio of liabilities to stockholders' equityDisplay both the company ratio and the industry benchmark on each graph. That is, each graph should have two lines.2. Prepare an analysis of the graphs in(1).arrow_forwardProfitability ratios help in the analysis of the combined impact of liquidity ratios, asset management ratios, and debt management ratios on the operating performance of a firm. Your boss has asked you to calculate the profitability ratios of St. McStanky Beer Co. and make comments on its second-year performance as compared with its first-year performance. The following shows St. McStanky Beer Co.'s income statement for the last two years. The company had assets of $3,525 million in the first year and $5,639 million in the second year. Common equity was equal to $1,875 million in the first year, and the company distributed 100% of its earnings out as dividends during the first and the second years. In addition, the firm did not issue new stock during either year. St. McStanky Beer Co. Income Statement For the Year Ending on ecember 31 (Millions of dollars) Year 2 Year 1 1,905 1,500 1,610 1,495 60 1,555 Net Sales Operating costs except depreciation and amortization Depreciation and…arrow_forward
- Profitability ratios help in the analysis of the combined impact of liquidity ratios, asset management ratios, and debt management ratios on the operating performance of a firm. Your boss has asked you to calculate the profitability ratios of Spandust Industries Inc. and make comments on its second-year performance as compared with its first-year performance. The following shows Spandust Industries Inc.’s income statement for the last two years. The company had assets of $7,050 million in the first year and $11,278 million in the second year. Common equity was equal to $3,750 million in the first year, and the company distributed 100% of its earnings out as dividends during the first and the second years. In addition, the firm did not issue new stock during either year. Spandust Industries Inc. Income Statement For the Year Ending on December 31 (Millions of dollars) Year 2 Year 1 Net Sales 3,810 3,000 Operating costs except depreciation and amortization 1,855 1,723…arrow_forwardProfitability ratios help in the analysis of the combined impact of liquidity ratios, asset management ratios, and debt management ratios on the operating performance of a firm. Your boss has asked you to calculate the profitability ratios of Diusitech Inc. and make comments on its second-year performance as compared with its first-year performance. The following shows Diusitech Inc.'s income statement for the last two years. The company had assets of $8,225 million in the first year and $13,157 million in the second year. Common equity was equal to $4,375 million in the first year, and the company distributed 100% of its earnings out as dividends during the first and the second years. In addition, the firm did not issue new stock during either year. Diusitech Inc. Income Statement For the Year Ending on December 31 (Millions of dollars) Year 2 Year 1 4,445 1,120 222 1,342 3,103 310 2,793 698 2,095 Net Sales Operating costs except depreciation and amortization Depreciation and…arrow_forwardProfitability ratios help in the analysis of the combined impact of liquidity ratios, asset management ratios, and debt management ratios on the operating performance of a firm. Your boss has asked you to calculate the profitability ratios of Petroxy Oil Co. and make comments on its second-year performance as compared with its first-year performance. The following shows Petroxy Oll Co.'s Income statement for the last two years. The company had assets of $9,400 million in the first year and $15,037 million in the second year. Common equity was equal to $5,000 million in the first year, and the company distributed 100% of its earnings out as dividends during the first and the second years. In addition, the firm did not issue new stock during either year. Petroxy Oil Co. Income Statement For the Year Ending on December 31 (Millions of dollars) Year 2 Year 1 4,000 1,268 Net Sales Operating costs except depreciation and amortization Depreciation and amortization Total Operating Costs…arrow_forward
- Financial Accounting CMulford: Financial Statement Analysis: 13 Using Return on Assets and Return on Equity to Compare Performance Across Companies Thiokol Corp. and Wyman-Gordon, Inc. In a recent fiscal year, Thiokol Corp. reported sales of $889.5 million and net income of $51.4 million. For the same year, Wyman-Gordon, reported sales of $499.6 million and net income of $25.2 million, about half the income of Thiokol. Both companies are in the same industry, aerospace and defense. Use the data provided below to compare financial performance for the two companies (amounts in millions). Thiokol $ 889.5 $ 51.4 $ 818.3 $ 447.9 Wyman-Gordon $ 499.6 $ 25.2 $ 375.9 $ 109.9 Sales Net income Total assets Shareholders' equity Calculate: Return on assets Return on equity Why is Return on equity so different for the two companies?arrow_forwardBusiness ratio analysis of financial statements over several years is generally helpful for the following reasons, EXCEPT Seleccione una: a. helps to evaluate management performance b. helps to forecast next year stock price level c. helps to evaluate the overall situation of the business d. helps to detect problem areas e. helps to set realistic future objectives price levelarrow_forwardProfitability ratios Your boss has asked you to calculate the profitability ratios of Triptych Food Corp. and make comments on its second-year performance as compared with its first-year performance. The following shows Triptych Food Corp.’s income statement for the last two years. The company had assets of $7,050 million in the first year and $11,278 million in the second year. Common equity was equal to $3,750 million in the first year, and the company distributed 100% of its earnings out as dividends during the first and the second years. In addition, the firm did not issue new stock during either year. Triptych Food Corp. Income Statement For the Year Ending on December 31 (Millions of dollars) Year 2 Year 1 Net Sales 3,810 3,000 Operating costs except depreciation and amortization 1,365 1,268 Depreciation and amortization 191 120 Total Operating Costs 1,556 1,388 Operating Income (or EBIT) 2,254 1,612 Less: Interest 304 169 Earnings before…arrow_forward
- Profitability ratios help in the analysis of the combined impact of liquidity ratios, asset management ratios, and debt management ratios on the operating performance of a firm. Your boss has asked you to calculate the profitability ratios of Petroxy Oil Co. and make comments on its second-year performance as compared with its first-year performance. The following shows Petroxy Oil Co.’s income statement for the last two years. The company had assets of $4,700 million in the first year and $7,518 million in the second year. Common equity was equal to $2,500 million in the first year, and the company distributed 100% of its earnings out as dividends during the first and the second years. In addition, the firm did not issue new stock during either year. Petroxy Oil Co. Income Statement For the Year Ending on December 31 (Millions of dollars) Year 2 Year 1 Net Sales 2,540 2,000 Operating costs except depreciation and amortization 1,610 1,495 Depreciation and…arrow_forwardSix measures of solvency or profitabilityThe following data were taken from the financial statements of GatesInc. for the current fiscal year. Assuming that long-term investments totaled $3,000,000 throughout theyear and that total assets were $7,000,000 at the beginning of the currentfiscal year, determine the following: (A) ratio of fixed assets to long-termliabilities, (B) ratio of liabilities to stockholders' equity, (C) assetturnover, (D) return on total assets, (E) return on stockholders" equity,and (F) return on common stockholders' equity. (Round ratios andpercentages to one decimal place as appropriate.)arrow_forward1. In FS analysis what is the basic objective of observing trends in data and ratios? 2. Distinguish between trend percentages and component percentages. Which would be better suited for analyzing the change in sales over a term of several years? 3. Net Sales of Premiere Gen. Store have been increasing at a reasonable rate but net income has been declining steadily as percentage of these sales? What appears to be the problem? 4. Under what circumstances would you consider a corporate net income P1million as being unreasonably LOW? HIGH? 1. What is the basic purpose for examining trends in a company's financial ratios and other data? 2. Why does an analyst compute financial ratios rather than simply studying raw financial data? 3. What is meant by financial leverage? 4. A company seeking a line of credit at a bank was turned down. The bank stated that the company's current ratio of 2:1 is not adequate. Can you give reasons why a 2:1 current ratio might not be adequate? 5. Why at…arrow_forward
 Managerial AccountingAccountingISBN:9781337912020Author:Carl Warren, Ph.d. Cma William B. TaylerPublisher:South-Western College Pub
 Managerial Accounting: The Cornerstone of Busines...AccountingISBN:9781337115773Author:Maryanne M. Mowen, Don R. Hansen, Dan L. HeitgerPublisher:Cengage Learning
 College Accounting, Chapters 1-27AccountingISBN:9781337794756Author:HEINTZ, James A.Publisher:Cengage Learning,