
(a)
To find out what is the sampling distribution of the mean blood arsenic concentration
(a)
Answer to Problem 14.10AYK
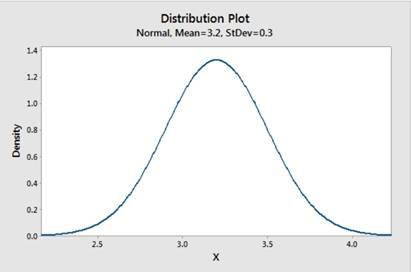
The sampling distribution of the mean blood arsenic concentration
Explanation of Solution
It is given in the question that Arsenic blood concentrations in healthy individuals are
Now, we know that the mean blood arsenic concentration
Thus, we have,
And the sketch of the density curve of this distribution is as follows:
(b)
To obtain P-value for this area and what would we conclude.
(b)
Answer to Problem 14.10AYK
The P-value is
Explanation of Solution
It is given in the question that Arsenic blood concentrations in healthy individuals are normally distributed with mean
And
Now, the first SRS gives,
So, we have the test statistics value and P-value as:
As we know that if the P-value is less than or equal to the significance level then the null hypothesis is rejected, so we have,
Thus, we conclude that we fail to reject the null hypothesis and there is no evidence that there is statistical difference.
(c)
To find out what would be the P-value for this area and what would we conclude.
(c)
Answer to Problem 14.10AYK
The P-value is
Explanation of Solution
It is given in the question that Arsenic blood concentrations in healthy individuals are normally distributed with mean
And
Now, the second SRS gives,
So, we have the test statistics value and P-value as:
As we know that if the P-value is less than or equal to the significance level then the null hypothesis is rejected, so we have,
Thus, we conclude that we fail to reject the null hypothesis and there is no evidence that there is statistical difference.
(d)
To explain briefly why these P-valuestell us that one outcome is strong evidence against the null hypothesis and that the other outcome is not.
(d)
Explanation of Solution
It is given in the question that Arsenic blood concentrations in healthy individuals are normally distributed with mean
And
Now, from the first SRS we get the P-value
Want to see more full solutions like this?
Chapter 14 Solutions
Practice of Statistics in the Life Sciences

 MATLAB: An Introduction with ApplicationsStatisticsISBN:9781119256830Author:Amos GilatPublisher:John Wiley & Sons Inc
 Probability and Statistics for Engineering and th...StatisticsISBN:9781305251809Author:Jay L. DevorePublisher:Cengage Learning
 Statistics for The Behavioral Sciences (MindTap C...StatisticsISBN:9781305504912Author:Frederick J Gravetter, Larry B. WallnauPublisher:Cengage Learning
 Elementary Statistics: Picturing the World (7th E...StatisticsISBN:9780134683416Author:Ron Larson, Betsy FarberPublisher:PEARSON
 The Basic Practice of StatisticsStatisticsISBN:9781319042578Author:David S. Moore, William I. Notz, Michael A. FlignerPublisher:W. H. Freeman
 Introduction to the Practice of StatisticsStatisticsISBN:9781319013387Author:David S. Moore, George P. McCabe, Bruce A. CraigPublisher:W. H. Freeman