
i.
To graph: The given functions in the same viewing widow.
To obtain the asymptote of the function the requirement is to find the point for which
Given:
The functions
Calculation:
The graph all the functions is given below in the same viewing window.
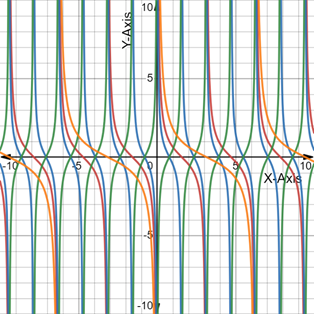
Here in the graph, the red lines represent the function
Conclusion:
Hence, the graph of the function is given above.
ii.
To describe: How the graph of given function changes on changing the value of
The frequency increases on increasing the value of
Given:
The functions is
Calculation:
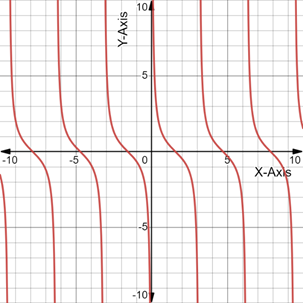
As the value of
The graph of
And the graph of
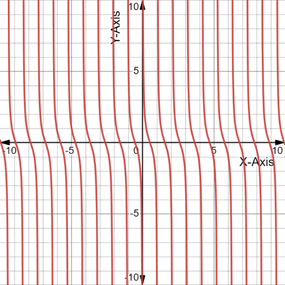
So, from both the graph, it is clear that the frequency increases on increasing the value of
Conclusion:
Hence, the frequency increases on increasing the value of
Chapter 13 Solutions
High School Math 2015 Common Core Algebra 2 Student Edition Grades 10/11

 Algebra and Trigonometry (6th Edition)AlgebraISBN:9780134463216Author:Robert F. BlitzerPublisher:PEARSON
 Contemporary Abstract AlgebraAlgebraISBN:9781305657960Author:Joseph GallianPublisher:Cengage Learning
 Linear Algebra: A Modern IntroductionAlgebraISBN:9781285463247Author:David PoolePublisher:Cengage Learning
 Algebra And Trigonometry (11th Edition)AlgebraISBN:9780135163078Author:Michael SullivanPublisher:PEARSON
 Introduction to Linear Algebra, Fifth EditionAlgebraISBN:9780980232776Author:Gilbert StrangPublisher:Wellesley-Cambridge Press
 College Algebra (Collegiate Math)AlgebraISBN:9780077836344Author:Julie Miller, Donna GerkenPublisher:McGraw-Hill Education