
Concept explainers
Videos
a.
Identify the predictors that could be used in the model to incorporate suppliers and lubrication regimens in addition to blank holder pressure.
a.
Answer to Problem 54E
The predictors that could be used in the model to incorporate suppliers and lubrication regimens in addition to blank holder pressure are given below:
Explanation of Solution
Given info:
The MINITAB output shows that the springback from the wall opening angle being predicted using blank holder pressure, three types of material suppliers and three types of lubrication regimens.
Calculation:
Dummy or indicator variable:
If there a categorical variable has k levels then k–1 dummy variables would be included in the model.
The material suppliers and lubrication regimens are categorical variables with three levels each.
For material suppliers:
Fix the third level as a base and create two dummy variables as shown below:
For lubrication regimens:
Fix the first level (no lubricant) as a base and create two dummy variables as shown below:
b.
Test the hypothesis to conclude whether the model specifies a useful relationship between springback from the wall opening angle and at least one of the five predictor variables.
b.
Answer to Problem 54E
There is sufficient evidence to conclude that the model specifies a useful relationship between the springback from the wall opening angle and at least one of the five predictor variables
Explanation of Solution
Given info:
The MINTAB output was given.
Calculation:
The test hypotheses are given below:
Null hypothesis:
That is, there is no use of linear relationship between springback from the wall opening angle and at least one of the five predictor variables.
Alternative hypothesis:
That is, there is a use of linear relationship between springback from the wall opening angle and at least one of the five predictor variables.
From the MINITAB output, it can be observed that the P-value corresponding to the F-statistic is 0.000.
Rejection region:
If
If
Conclusion:
The P- value is 0.000 and the level of significance is 0.001.
The P- value is lesser than the level of significance.
That is,
Thus, the null hypothesis is rejected,
Hence, there is sufficient evidence to conclude that there is a use of linear relationship between springback from the wall opening angle and at least one of the five predictor variables.
c.
Calculate the 95% prediction interval for the springback from the wall opening angle when BHP is 1,000, material from supplier 1 and no lubrication.
c.
Answer to Problem 54E
The 95% prediction interval for the predicted springback from the wall opening angle when BHP is 1,000, material from supplier 1 and no lubrication is
Explanation of Solution
Given info:
The BHP is 1,000, material from supplier 1 and no lubrication. The corresponding standard deviation for prediction is 0.524.
Calculation:
The prediction value of springback from the wall opening angle when BHP is 1,000, material from supplier 1 and no lubrication is calculated as follows:
Thus, the prediction value of springback from the wall opening angle when BHP is 1,000, material from supplier 1 and no lubrication is 16.4461.
95% prediction interval:
The prediction interval is calculated using the formula:
Where,
n is the total number of observations.
k is the total number of predictors in the model.
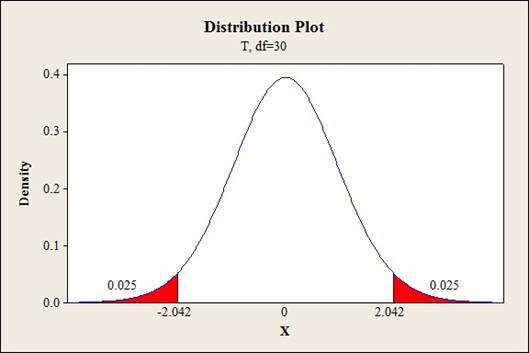
Critical value:
Software procedure:
Step-by-step procedure to find the critical value is given below:
- Click on Graph, select View Probability and click OK.
- Select t, enter 30 as Degrees of freedom, inShaded Area Tab select Probability under Define Shaded Area By and choose Both tails.
- Enter Probability value as 0.05.
- Click OK.
Output obtained from MINITAB is given below:
The 95% confidence interval for the predicted amount of beta carotene is calculated as follows:
Thus, the 95% prediction interval for the predicted springback from the wall opening angle when BHP is 1,000, material from supplier 1 and no lubricationis
d.
Find the coefficient of multiple determination.
Give the conclusion stating the importance of lubrication regimen.
d.
Answer to Problem 54E
The coefficient of multiple determination is 74.1%
The lubrication regimen is not important because there is not much of a difference in the coefficient of multiple determination even after removing the two variables corresponding to lubrication.
The two variables corresponding to lubrication shows no effect and need not be included in the model as long as the other predictors BHP and suppliers were retained.
Explanation of Solution
Given info:
The SSE after removing the variables corresponding to lubrication regimen is 48.426.
Calculation:
Coefficient of determination:
The coefficient of determination tells the total amount of variation in the dependent variable explained by the independent variable. It
Substitute 48.426 as SSE and 186.980 as SST.
Thus, the coefficient of multiple determination is 74.1%
The test hypotheses are given below:
Null hypothesis:
That is, the two dummy variables corresponding to lubrication are not significant to explain the variation in springback from wall opening angle.
Alternative hypothesis:
That is, At least one of the two dummy variables corresponding to lubrication is significant to explain the variation in springback from wall opening angle.
Test statistic:
Where,
n represents the total number of observations,
k represents the number of predictors on the full model.
l represents the number of predictors on the reduced model.
Substitute 48.426for
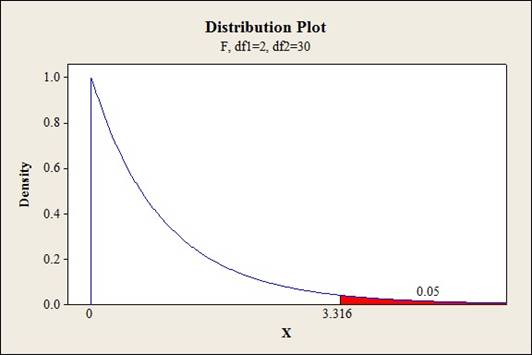
Critical value:
Software procedure:
- Click on Graph, select View Probability and click OK.
- Select F, enter 2 in numerator df and 30 in denominator df.
- Under Shaded Area Tab select Probability under Define Shaded Area By and select Right tail.
- Choose Probability value as 0.05.
- Click OK.
Output obtained from MINITAB is given below:
Conclusion:
Coefficient of determination:
The coefficient of determination for the whole model including the two variables corresponding to lubrication is 77.5% whereas the coefficient of multiple determination after removing the two variables corresponding to lubrication is 74.1%. Thus, there is a slight drop in coefficient of multiple determination.
Testing the hypothesis:
The test statistic value is 2.268 and the critical value is 3.316.
The test statistic is lesser than the critical value.
That is,
Thus, the null hypothesis is not rejected,
Hence, there is sufficient evidence to conclude thatthe two dummy variables corresponding to lubrication are not significant to explain the variation in springback from wall opening angle.
e.
Identify whether the given model has improved than the model specified in part (d).
e.
Answer to Problem 54E
Yes, the given model has improved than the model specified in part (d).
There is sufficient evidence to conclude thatthe addition of interaction terms is significant to explain the variation in springback from wall opening angle at 5% level of significance.
Explanation of Solution
Given info:
A regression model is built with the five predictors and the interactions between BHP and the four dummy variables.
The resulting SSE is 28.216 and the
Calculation:
The test hypotheses are given below:
Null hypothesis:
That is, the addition of interaction terms is not significant to explain the variation in the dependent variable y.
Alternative hypothesis:
That is, at least one of theinteraction terms is significant to explain the variation in the dependent variable y.
The degrees of freedom for the regression would be 4.
The degrees of freedom for the error would be
Test statistic:
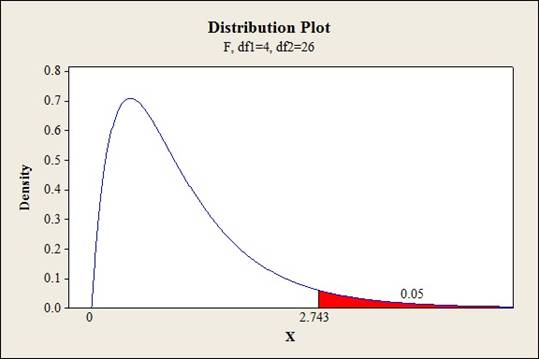
Critical value:
Software procedure:
- Click on Graph, select View Probability and click OK.
- Select F, enter 4 in numerator df and 26 in denominator df.
- Under Shaded Area Tab select Probability under Define Shaded Area By and select Right tail.
- Choose Probability value as 0.05.
- Click OK.
Output obtained from MINITAB is given below:
Conclusion:
The test statistic value is 3.191 and the critical value is 2.743.
The test statistic is greater than the critical value.
That is,
Thus, the null hypothesis is rejected,
Hence, there issufficient evidence to conclude thatthe addition of interaction terms is significant to explain the variation in springback from wall opening angle at 5% level of significance.
Want to see more full solutions like this?
Chapter 13 Solutions
Student Solutions Manual for Devore's Probability and Statistics for Engineering and the Sciences, 9th


- The article "Experimental Measurement of Radiative Heat Transfer in Gas-Solid Suspension Flow System" (G. Han, K. Tuzla, and J. Chen, AIChe Journal, 2002:1910- 1916) discusses the calibration of a radiometer. Several measurements were made on the electromotive force readings of the radiometer (in volts) and the radiation flux (in kilowatts per square meter). The results (read from a graph) are presented in the following table. Heat flux (y) 15 31 51 55 67 89 Signal output (x) 1.08 2.42 4.17 4.46 5.17 6.92 Compute the least-squares line for predicting heat flux from the signal output. If the radiometer reads 3.00 V, predict the heat flux. If the radiometer reads 8.00 V, should the heat flux be predicted? If so, predict it. If not, explain why. C.arrow_forwardThe article "Effect of Granular Subbase Thickness on Airfield Pavement Structural Response" (K. Gopalakrishnan and M. Thompson, Journal of Materials in Civil Engineering, 2008:331-342) presents a study of the amount of surface deflection caused by aircraft landing on an airport runway. A load of 160 kN was applied to a runway surface, and the amount of deflection in mm (y) was measured at various distances in m (x) from the point of application. The results are presented in the following table. y 0.000 3.24 0.305 2.36 0.610 1.42 0.914 0.87 1.219 0.54 1.524 0.34 1.830 0.24 a. Fit the linear model y = Bo + B1x + ɛ. For each coefficient, test the hypothesis that the coefficient is equal to 0. b. Fit the quadratic model y = Bo + Bịx + B2x² + ɛ. For each coefficient, test the hypothesis that the coefficient is equal to 0. %3D Fit the cubic model y = Bo + B1x + B2x? + B3x + E. For each coefficient, test the C. hypothesis that the coefficient is equal to 0. d. Which of the models in parts (a)…arrow_forwardThe article "Change in Creep Behavior of Plexiform Bone with Phosphate Ion Treatment" (R. Regimbal, C. DePaula, and N. Guzelsu, Bio-Medical Materials and Engineering, 2003:11-25) describes an experiment to study the effects of saline and phosphate ion solutions on mechanical properties of plexiform bone. The following table presents the yield stress measurements for six specimens treated with either saline (NaCI) or phosphate ion (Na,HPO4) solution, at a temperature of either 25°C or 37°C. (The article presents means and standard deviations only; the values in the table are consistent with these.) Solution Temperature NaCl Yield Stress (MPa) 138.40 130.89 94.646 96.653 116.90 88.215 25°C NaCl 37°C 92.312 147.28 116.48 88.802 114.37 90.737 Na,HPO, 25°C 120.18 129.43 139.76 132.75 137.23 121.73 Na,HPO4 37°C 123.50 128.94 102.86 99.941 161.68 136.44 a. Estimate all main effects and interactions. b. Construct an ANOVA table. You may give ranges for the P-values. Is the additive model…arrow_forward
- Wrinkle recovery angle and tensile strength are the two most important characteristics for evaluating the performance of crosslinked cotton fabric. An increase in the degree of crosslinking, as determined by ester carboxyl band absorbance, improves the wrinkle resistance of the fabric (at the expense of reducing mechanical strength). The accompanying data on x = absorbance and y = wrinkle resistance angle was read from a graph in the paper "Predicting the Performance of Durable Press Finished Cotton Fabric with Infrared Spectroscopy".† x 0.115 0.126 0.183 0.246 0.282 0.344 0.355 0.452 0.491 0.554 0.651 y 334 342 355 363 365 372 381 392 400 412 420 Here is regression output from Minitab: Predictor Constant absorb S = 3.60498 Coef 321.878 156.711 SOURCE Regression Residual Error Total SE Coef 2.483 6.464 R-Sq = 98.5% DF 1 9 10 SS 7639.0 117.0 7756.0 T 129.64 24.24 0.000 0.000 R-Sq (adj) = 98.3% MS 7639.0 13.0 F P 587.81 (a) Does the simple linear regression model appear to be…arrow_forwardWrinkle recovery angle and tensile strength are the two most important characteristics for evaluating the performance of crosslinked cotton fabric. An increase in the degree of crosslinking, as determined by ester carboxyl band absorbance, improves the wrinkle resistance of the fabric (at the expense of reducing mechanical strength). The accompanying data on x = absorbance and y = wrinkle resistance angle was read from a graph in the paper "Predicting the Performance of Durable Press Finished Cotton Fabric with Infrared Spectroscopy".t 半 0.115 0.126 0.183 0.246 0.282 0.344 0.355 0.452 0.491 0.554 0.651 334 342 355 363 365 372 381 392 400 412 420 Here is regression output from Minitab: Predictor Coef SE Coef P Constant 321.878 2.483 129.64 0.000 absorb 156.711 6.464 24.24 0.000 S = 3.60498 R-Sq = 98.5% R-Są (adj) - 98.3% SOURCE DF MS F P Regression 1 7639.0 7639.0 587.81 0.000 Residual Error 9 117.0 13.0 Total 10 7756.0 (a) Does the simple linear regression model appear to be…arrow_forwardWrinkle recovery angle and tensile strength are the two most important characteristics for evaluating the performance of crosslinked cotton fabric. An increase in the degree of crosslinking, as determined by ester carboxyl band absorbance, improves the wrinkle resistance of the fabric (at the expense of reducing mechanical strength). The accompanying data on x = absorbance and y = wrinkle resistance angle was read from a graph in the paper "Predicting the Performance of Durable Press Finished Cotton Fabric with Infrared Spectroscopy".t x 0.115 0.126 0.183 0.246 0.282 0.344 0.355 0.452 0.491 0.554 0.651 y 334 342 355 363 365 372 381 400 392 412 420 Here is regression output from Minitab: Predictor Constant absorb S = 3.60498 Coef 321.878 156.711 SOURCE Regression Residual Error Total R-Sq= 98.5% DF SE Coef 2.483 6.464 1 9 10 SS 7639.0 117.0 7756..0 T 129.64 24.24 P 0.000 0.000. R-Sq (adj) 98.3% MS 7639.0 13.0 F 587.81 (a) Does the simple linear regression model appear to be appropriate?…arrow_forward
- The article “Some Parameters of the Population Biology of Spotted Flounder (Ciutharuslinguatula Linnaeus, 1758) in Edremit Bay (North Aegean Sea)” (D. Türker, B. Bayhan, etal., Turkish Journal of Veterinary and Animal Science, 2005:1013–1018) models therelationship between weight W and length L of spotted flounder as W = aLb where a and bare constants to be estimated from data. Transform this equation to produce a linear model.arrow_forwardWhat is the significance of R and R2 in gression model?arrow_forward4. A study to assess the capability of subsurface flow wetland systems to remove biochemical oxygen demand (BOD) and various other chemical constituents resulted in the accompanying data on z = BOD mass loading (kg/ha/d) and y = BOD mass removal (kg/ha/d) ("Subsurface Flow Wetlands-A Performance Evaluation." Water Envir. Res., 1995: 244-247). x Y 11 8 13 16 27 10 11 16 142 35 38 44 103 30 90 75 31 30 26 21 n = 10; Σ | n = 450; Σα" = 37653; Σy = 318; Σ y = 17244; Σ =y = 25344 Answer the following questions: (a) Plot an appropriate graph for the data. (b) Obtain the best lincar prediction equation. (c) For every additional unit change in BOD mass loading, by how much does the BOD mass removal change, on average? (d) Give the value of the statistic that measures the linear association between the BOD mass loading and BOD mass removal. Comment. (e) What percent of variation in the BOD mass removal is explained by the variation by the BOD mass loading? (f) Predict the BOD mass removal,…arrow_forward
- The article "Effect of Granular Subbase Thickness on Airfield Pavement Structural Response" (K. Gopalakrishnan and M. Thompson, Journal of Materials in Civil Engineering, 2008:331-342) presents a study of the effect of the subbase thickness (in mm) on the amount of surface deflection caused by aircraft landing on an airport runway. Two landing gears, one simulating a Boeing 747 aircraft, and the other a Boeing 777 aircraft, were trafficked across four test sections of runway. The results are presented in the following table. Section 3 4 Boeing 747 Boeing 777 4.01 3.87 3.72 3.76 4.57 4.48 4.36 4.43 Can you conclude that the mean deflection is greater for the Boeing 777?arrow_forwardEXAMPLE 8.5 | Alloy Adhesion An article in the Journal of Materials Engineering ["Instrumented Tensile Adhesion Tests on Plasma Sprayed Thermal Barrier Coatings" (1989, Vol. 11(4), pp. 275-282)] describes the results of tensile adhesion tests on 22 U-700 alloy specimens. The load at specimen failure is as follows (in megapascals): 19.8 15.4 11.4 19.5 10.1 18.5 14.1 8.8 14.9 7.9 17.6 13.6 O 0.01 O 0.025 O 0.05 O 0.95 O 0.975 7.5 12.7 16.7 11.9 15.4 11.9 15.8 11.4 The sample mean is x = 13.71, and the sample standard deviation is s = 3.55. Figures 8.6 and 8.7 show a box plot and a normal probability plot of the tensile adhesion test data, respectively. These displays provide good support for the assumption that the population is normally distributed. We want to find a 95% CI on μ. Since n = 22, we have n - 1 = 21 degrees of freedom for t, so to.025,21 = 2.080. The resulting CI is X-1/2-1/√x+1a/2n-1³/√n 13.71-2.080 (3.55)/√/22 ≤ ≤ 13.71 +2.080 (3.55)/√22 13.711.57 ≤ ≤ 13.71 +1.57 12.14 ≤…arrow_forwardThe depth of wetting of a soil is the depth to which water content will increase owing to extemal factors. The article "Discussion of Method for Evaluation of Depth of Wetting in Residential Areas" (J. Nelson, K. Chao, and D. Overton, Journal of Geotechnical and Geoenvironmental Engineering, 2011:293-296) discusses the relationship between depth of wetting beneath a structure and the age of the structure. The article presents measurements of depth of wetting, in meters, and the ages, in years, of 21 houses, as shown in the following table. Age Depth 7.6 4 4.6 6.1 9.1 3 4.3 7.3 5.2 10.4 15.5 5.8 10.7 4 5.5 6.1 10.7 10.4 4.6 7.0 6.1 14 16.8 10 9.1 8.8 Compute the least-squares line for predicting depth of wetting (y) from age (x). b. Identify a point with an unusually large x-value. Compute the least-squares line that results from deletion of this point. Identify another point which can be classified as an outlier. Compute the least-squares line that results from deletion of the outlier,…arrow_forward
 Linear Algebra: A Modern IntroductionAlgebraISBN:9781285463247Author:David PoolePublisher:Cengage Learning