
Videos
(a)
To find: The inequality represented by each graph.
(a)
Answer to Problem 2PSA
The inequality is
Explanation of Solution
Given:
The given graph is:
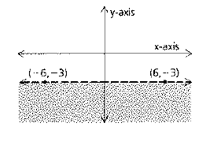
Graph is described as:
Boundary has the equation
And the shaded part does not contain the origin.
So the equation of inequality is given as:
Therefore, the inequality is
(b)
To find: The inequality represented by each graph.
(b)
Answer to Problem 2PSA
The inequality is
Explanation of Solution
Given:
The given graph is:
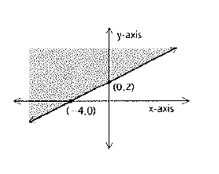
Graph is described as:
The equation boundary is given as:
Boundary has equation
And the shaded part does not contain the origin.
So the equation of inequality is given as:
Therefore, the inequality is
Chapter 13 Solutions
Geometry For Enjoyment And Challenge
Additional Math Textbook Solutions
Essentials of Statistics (6th Edition)
Intermediate Algebra
A First Course in Probability (10th Edition)
Precalculus Enhanced with Graphing Utilities (7th Edition)
Elementary Algebra
Statistics: The Art and Science of Learning from Data (4th Edition)


 Elementary Geometry For College Students, 7eGeometryISBN:9781337614085Author:Alexander, Daniel C.; Koeberlein, Geralyn M.Publisher:Cengage,
 Elementary Geometry for College StudentsGeometryISBN:9781285195698Author:Daniel C. Alexander, Geralyn M. KoeberleinPublisher:Cengage Learning