
Videos
Consumer Preferences. In 2018, consumer goods giant Procter and Gamble (P&G) had more than 20 brands with more than $1 billion in annual sales (P&G website, https://us.pg.com/). How does a company like P&G create so many successful consumer products? P&G effectively invests in research and development to understand what consumers want. One method used to determine consumer preferences is called conjoint analysis. Conjoint analysis allows a company to ascertain the utility that a respondent in the conjoint study places on a design of a given product. The higher the utility, the more valuable a respondent finds the design. Suppose we have conducted a conjoint study and have the following estimated utilities (higher is preferred) for each of three different designs for a new whitening toothpaste.
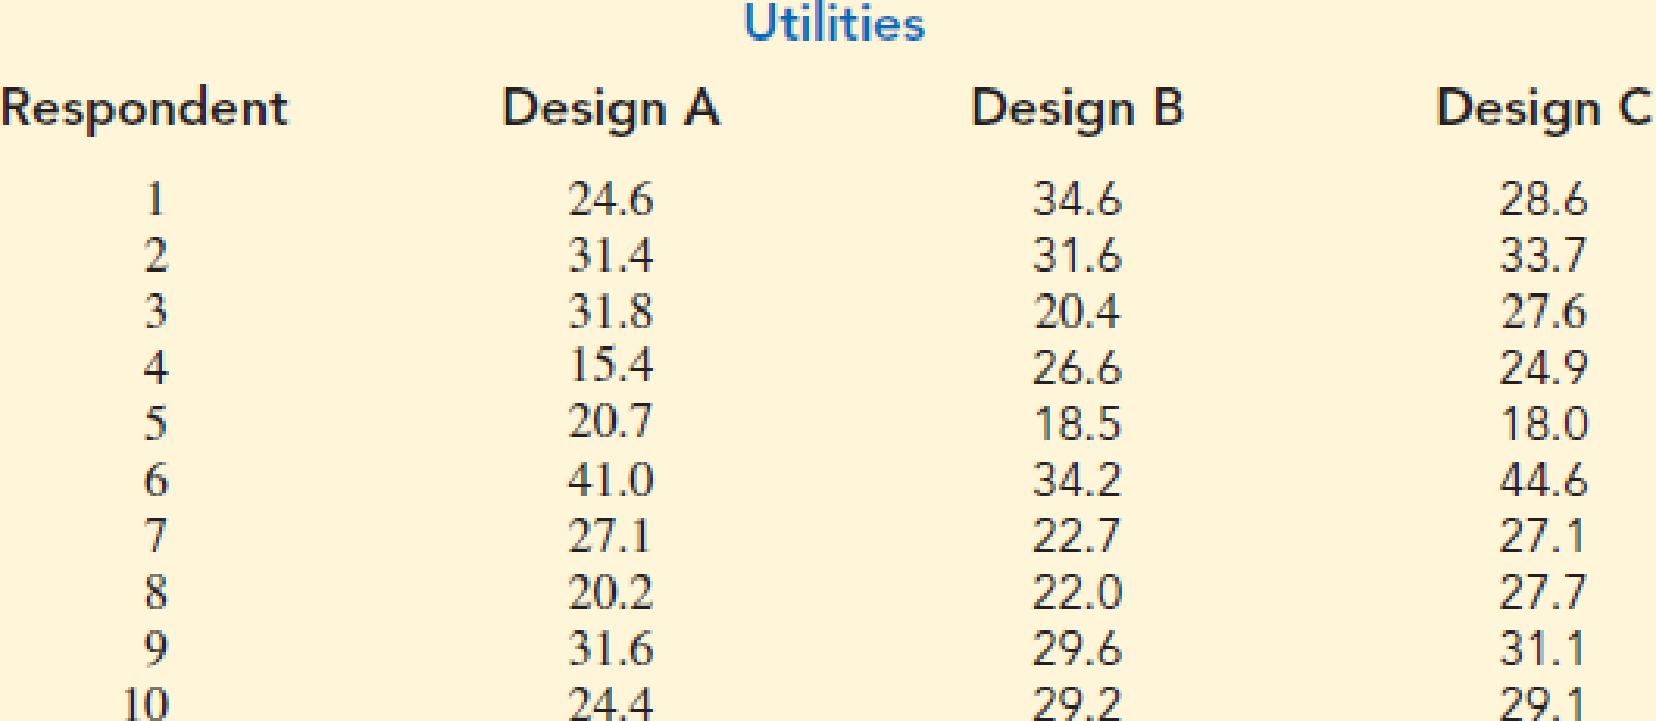
At the .05 level of significance, test for any significant differences.

Trending nowThis is a popular solution!

Chapter 13 Solutions
Essentials Of Statistics For Business & Economics


- Opinions are split about a coffee company's pumpkin-flavored coffee (PFC). Yet every year over the last five years the consumption of pumpkin-flavored goods has increased. If we look at the numbers, it also becomes clear why a leading coffee company keeps offering the PFC earlier and earlier every year. According to a magazine, the amount spent by PFC buyers at the coffee company is about 17% higher than non-PFC buyers. The accompanying table shows a random sample of eight consumers, the amount they spend per week, and the number of PFCs purchased per week. PFC Spending 2 13.88 7 39.11 4 19.79 1 9.84 3 15.43 1 21.52 5 37.39 3 13.85 The slope is b1=4.465 The y-intercept is b0=6.840 Because the slope is positive, it can be concluded that one extra PFC purchase per week will increase the average amount of spending per week by 4.46 dollars. Predict…arrow_forwardOpinions are split about a coffee company's pumpkin-flavored coffee (PFC). Yet every year over the last five years the consumption of pumpkin-flavored goods has increased. If we look at the numbers, it also becomes clear why a leading coffee company keeps offering the PFC earlier and earlier every year. According to a magazine, the amount spent by PFC buyers at the coffee company is about 17% higher than non-PFC buyers. The accompanying table shows a random sample of eight consumers, the amount they spend per week, y, and the number of PFCs purchased, x, per week. PFC Spending 1 13.17 8 38.65 3 19.49 2 9.56 4 15.85 1 21.82 5 37.53 3 13.69 α=0.05 t= 3.07 p-value= 0.22 Construct a 95% confidence interval for the population slope. UCL = LCL = (Round to two decimal places as needed.)arrow_forwardOpinions are split about a coffee company's pumpkin-flavored coffee (PFC). Yet every year over the last five years the consumption of pumpkin-flavored goods has increased. If we look at the numbers, it also becomes clear why a leading coffee company keeps offering the PFC earlier and earlier every year. According to a magazine, the amount spent by PFC buyers at the coffee company is about 17% higher than non-PFC buyers. The accompanying table shows a random sample of eight consumers, the amount they spend per week, and the number of PFCs purchased per week. PFC Spending 2 13.88 7 39.11 4 19.79 1 9.84 3 15.43 1 21.52 5 37.39 3 13.85 Calculate the slope and y-intercept for the regression formula. The slope is b1=4.465 The y-intercept is b0=6.840 Provide an interpretation for the value of the slope. Because the slope is positive, it can be…arrow_forward
- Opinions are split about a coffee company's pumpkin-flavored coffee (PFC). Yet every year over the last five years the consumption of pumpkin-flavored goods has increased. If we look at the numbers, it also becomes clear why a leading coffee company keeps offering the PFC earlier and earlier every year. According to a magazine, the amount spent by PFC buyers at the coffee company is about 17% higher than non-PFC buyers. The accompanying table shows a random sample of eight consumers, the amount they spend per week, and the number of PFCs purchased per week. PFC Spending 2 13.88 7 39.11 4 19.79 1 9.84 3 15.43 1 21.52 5 37.39 3 13.85 Calculate the slope and y-intercept for the regression formula. The slope is b1=(Round to three decimal places as needed.)arrow_forwardOpinions are split about a coffee company's pumpkin-flavored coffee (PFC). Yet every year over the last five years the consumption of pumpkin-flavored goods has increased. If we look at the numbers, it also becomes clear why a leading coffee company keeps offering the PFC earlier and earlier every year. According to a magazine, the amount spent by PFC buyers at the coffee company is about 17% higher than non-PFC buyers. The accompanying table shows a random sample of eight consumers, the amount they spend per week, and the number of PFCs purchased per week. PFC Spending 2 13.88 7 39.11 4 19.79 1 9.84 3 15.43 1 21.52 5 37.39 3 13.85 The slope is b1=4.465 The y-intercept is b0=(Round to three decimal places as needed.)arrow_forwardOpinions are split about a coffee company's pumpkin-flavored coffee (PFC). Yet every year over the last five years the consumption of pumpkin-flavored goods has increased. If we look at the numbers, it also becomes clear why a leading coffee company keeps offering the PFC earlier and earlier every year. According to a magazine, the amount spent by PFC buyers at the coffee company is about 17% higher than non-PFC buyers. The accompanying table shows a random sample of eight consumers, the amount they spend per week, y, and the number of PFCs purchased, x, per week. PFC Spending 1 13.17 8 38.65 3 19.49 2 9.56 4 15.85 1 21.82 5 37.53 3 13.69 t= 3.07 Identify the p-value p-value= (Round to three decimal places as needed.)arrow_forward
- Opinions are split about a coffee company's pumpkin-flavored coffee (PFC). Yet every year over the last five years the consumption of pumpkin-flavored goods has increased. If we look at the numbers, it also becomes clear why a leading coffee company keeps offering the PFC earlier and earlier every year. According to a magazine, the amount spent by PFC buyers at the coffee company is about 17% higher than non-PFC buyers. The accompanying table shows a random sample of eight consumers, the amount they spend per week, y, and the number of PFCs purchased, x, per week. PFC Spending 1 13.17 8 38.65 3 19.49 2 9.56 4 15.85 1 21.82 5 37.53 3 13.69 α=0.05 t= 3.07 p-value= 0.022 Construct a 95% confidence interval for the population slope. UCL = 6.69 LCL = 0.75 What conclusions about PFC purchases and spending can be drawn from these…arrow_forwardOpinions are split about a coffee company's pumpkin-flavored coffee (PFC). Yet every year over the last five years the consumption of pumpkin-flavored goods has increased. If we look at the numbers, it also becomes clear why a leading coffee company keeps offering the PFC earlier and earlier every year. According to a magazine, the amount spent by PFC buyers at the coffee company is about 17% higher than non-PFC buyers. The accompanying table shows a random sample of eight consumers, the amount they spend per week, y, and the number of PFCs purchased, x, per week. PFC Spending 1 13.17 8 38.65 3 19.49 2 9.56 4 15.85 1 21.82 5 37.53 3 13.69 α=0.05 Calculate the test statistic for the hypothesis test. t= (Round to two decimal places as needed.)arrow_forwardZeikia has just been named the director of alumni relationships at a local university. Alumni donations are an important source of revenue for colleges and universities. If administrators could determine the factors that could lead to increases in the percentage of alumni who make a donation, they might be able to implement policies that could lead to increased revenues. Research shows that students who are more satisfied with their contact with teachers are more likely to graduate. As a result, one might suspect that smaller class sizes and lower student/faculty ration might lead to a higher percentage of satisfied graduates, which in turn might lead to increases in percentage of alumni who make a donation. Zeikia is feeling an extra pressure to increase total giving to the university because of recent budget cuts. Zeikia is also feeling pressured to increase the percentage of alumni to give. Zeikia found this new metric called average alumni giving rate U.S. News & World Report.…arrow_forward
- Calie has just been named the director of alumni relationships at a local university. Alumni donations are an important source of revenue for colleges and universities. If administrators could determine the factors that could lead to increases in the percentage of alumni who make a donation, they might be able to implement policies that could lead to increased revenues. Research shows that students who are more satisfied with their contact with teachers are more likely to graduate. As a result, one might suspect that smaller class sizes and lower student/faculty ration might lead to a higher percentage of satisfied graduates, which in turn might lead to increases in percentage of alumni who make a donation. Calie is feeling an extra pressure to increase total giving to the university because of recent budget cuts. Calie is also feeling pressured to increase the percentage of alumni to give. Calie found this new metric called average alumni giving rate U.S. News & World Report.…arrow_forwardCalie has just been named the director of alumni relationships at a local university. Alumni donations are an important source of revenue for colleges and universities. If administrators could determine the factors that could lead to increases in the percentage of alumni who make a donation, they might be able to implement policies that could lead to increased revenues. Research shows that students who are more satisfied with their contact with teachers are more likely to graduate. As a result, one might suspect that smaller class sizes and lower student/faculty ration might lead to a higher percentage of satisfied graduates, which in turn might lead to increases in percentage of alumni who make a donation. Calie is feeling an extra pressure to increase total giving to the university because of recent budget cuts. Calie is also feeling pressured to increase the percentage of alumni to give. Calie found this new metric called average alumni giving rate U.S. News & World Report.…arrow_forwardCalie has just been named the director of alumni relationships at a local university. Alumni donations are an important source of revenue for colleges and universities. If administrators could determine the factors that could lead to increases in the percentage of alumni who make a donation, they might be able to implement policies that could lead to increased revenues. Research shows that students who are more satisfied with their contact with teachers are more likely to graduate. As a result, one might suspect that smaller class sizes and lower student/faculty ration might lead to a higher percentage of satisfied graduates, which in turn might lead to increases in percentage of alumni who make a donation. Calie is feeling an extra pressure to increase total giving to the university because of recent budget cuts. Calie is also feeling pressured to increase the percentage of alumni to give. Calie found this new metric called average alumni giving rate U.S. News & World Report.…arrow_forward
 Glencoe Algebra 1, Student Edition, 9780079039897...AlgebraISBN:9780079039897Author:CarterPublisher:McGraw Hill
 Big Ideas Math A Bridge To Success Algebra 1: Stu...AlgebraISBN:9781680331141Author:HOUGHTON MIFFLIN HARCOURTPublisher:Houghton Mifflin Harcourt