Statistics: The Art and Science of Learning from Data (4th Edition)
4th Edition
ISBN: 9780321997838
Author: Alan Agresti, Christine A. Franklin, Bernhard Klingenberg
Publisher: PEARSON
bartleby

Concept explainers

bartleby

Videos

Textbook Question
Book Icon
Chapter 13.3, Problem 26PB

Any predictive power? Refer to the previous three exercises.

  1. a. State and interpret the null hypothesis tested with the F statistic in the ANOVA table given in Exercise 13.23.
  2. b. From the F table (Table D), which F statistic value would have a P-value of 0.05 for these data?
  3. c. Report the observed F test statistic and its P-value. Interpret the P-value, and make a decision for a 0.05 significance level. Explain in nontechnical terms what the result of the test means.

13.23 Does leg press help predict body strength? Chapter 12 analyzed strength data for 57 female high school athletes. Upper body strength was summarized by the maximum number of pounds the athlete could bench press (denoted maxBP). This was predicted well by the number of times she could do a 60-pound bench press (denoted BP60). Can we predict maxBP even better if we also know how many times an athlete can perform a 200-pound leg press? The table shows results after adding this second predictor (denoted LP200) to the model.

Chapter 13.3, Problem 26PB, Any predictive power? Refer to the previous three exercises. a. State and interpret the null

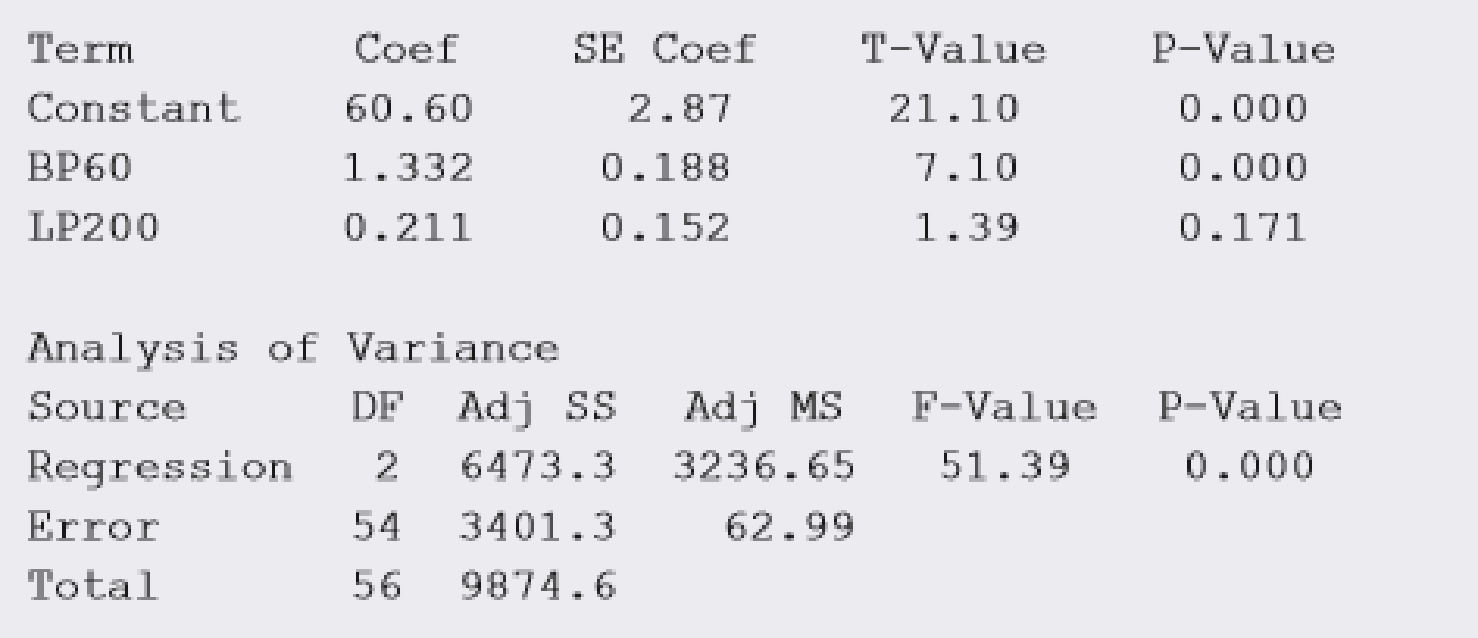
  1. a. Does LP200 have a significant effect on maxBP if BP60 is also in the model? Show all steps of a significance test to answer this.
  2. b. Show that the 95% confidence interval for the slope for LP200 equals 0.21 ± 0.30, roughly (−0.1, 0.5). Based on this interval, does LP200 seem to have a strong impact, or a weak impact, on predicting maxBP if BP60 is also in the model?
  3. c. Given that LP200 is in the model, provide evidence from a significance test that shows why it does help to add BP60 to the model.

13.24 Leg press uncorrelated with strength? The P-value of 0.17 in part a of the previous exercise suggests that LP200 plausibly had no effect on maxBP once BP60 is in the model. Yet when LP200 is the sole predictor of BP, the correlation is 0.58 and the significance test for its effect has a P-value of 0.000, suggesting very strong evidence of an effect. Explain why this is not a contradiction.

13.25 Interpret strength variability Refer to the previous two exercises. The sample standard deviation of maxBP was 13.3. The residual standard deviation of maxBP when BP60 and LP200 are predictors in a multiple regression model is 7.9.

  1. a. Explain the difference between the interpretations of these two standard deviations.
  2. b. If the conditional distributions of maxBP are approximately bell shaped, explain why most maximum bench press values fall within about 16 pounds of the regression equation when the predictors BP60 and LP200 are near their sample mean values.
  3. c. At BP60 = 11 and LP200 = 22, which are close to the sample mean values, software reports y ^ = 80 and a 95% prediction interval of 80 ± 16, or (64, 96). Is this interval an inference about where the population maxBP values fall or where the population mean of the maxBP values fall (for subjects having BP60 = 11 and LP200 = 22)? Explain.
  4. d. Refer to part c. Would it be unusual for a female athlete with these predictor values to be able to bench press more than 100 pounds? Why?
Blurred answer

Chapter 13 Solutions

Statistics: The Art and Science of Learning from Data (4th Edition)

Ch. 13.1 - Used cars The following data (also available from...Ch. 13.2 - Predicting sports attendance Keeneland Racetrack...Ch. 13.2 - Predicting weight Lets use multiple regression to...Ch. 13.2 - Prob. 14PBCh. 13.2 - Price of used cars For the 19 used cars listed in...Ch. 13.2 - Prob. 16PBCh. 13.2 - Softball data For the Softball data set on the...Ch. 13.2 - Slopes, correlations, and units In Example 2 on y...Ch. 13.2 - Predicting college GPA Using software with the...Ch. 13.3 - Predicting GPA For the 59 observations in the...Ch. 13.3 - Study time help GPA? Refer to the previous...Ch. 13.3 - Variability in college GPA Refer to the previous...Ch. 13.3 - Does leg press help predict body strength? Chapter...Ch. 13.3 - Prob. 24PBCh. 13.3 - Interpret strength variability Refer to the...Ch. 13.3 - Any predictive power? Refer to the previous three...Ch. 13.3 - Predicting pizza revenue Aunt Ermas Pizza...Ch. 13.3 - Prob. 28PBCh. 13.3 - Mental health again Refer to the previous...Ch. 13.3 - Prob. 30PBCh. 13.3 - House prices Use software to do further analyses...Ch. 13.4 - Body weight residuals Examples 47 used multiple...Ch. 13.4 - Strength residuals In Chapter 12, we analyzed...Ch. 13.4 - Prob. 34PBCh. 13.4 - Nonlinear effects of age Suppose you fit a...Ch. 13.4 - Prob. 36PBCh. 13.4 - Why inspect residuals? When we use multiple...Ch. 13.4 - College athletes The College Athletes data set on...Ch. 13.4 - House prices Use software with the House Selling...Ch. 13.4 - Prob. 40PBCh. 13.5 - U.S. and foreign used cars Refer to the used car...Ch. 13.5 - Prob. 42PBCh. 13.5 - Predict using house size and condition For the...Ch. 13.5 - Quality and productivity The table shows data from...Ch. 13.5 - Predicting hamburger sales A chain restaurant that...Ch. 13.5 - Prob. 46PBCh. 13.5 - House size and garage interact? Refer to the...Ch. 13.5 - Prob. 48PBCh. 13.5 - Comparing sales You own a gift shop that has a...Ch. 13.6 - Prob. 50PBCh. 13.6 - Prob. 51PBCh. 13.6 - Prob. 52PBCh. 13.6 - Prob. 53PBCh. 13.6 - Prob. 54PBCh. 13.6 - Prob. 55PBCh. 13.6 - Prob. 56PBCh. 13.6 - Prob. 57PBCh. 13.6 - Prob. 58PBCh. 13.6 - Prob. 59PBCh. 13 - House prices This chapter has considered many...Ch. 13 - Prob. 61CPCh. 13 - Prob. 62CPCh. 13 - Prob. 63CPCh. 13 - Prob. 64CPCh. 13 - Prob. 65CPCh. 13 - Prob. 66CPCh. 13 - Prob. 67CPCh. 13 - Prob. 68CPCh. 13 - Prob. 69CPCh. 13 - AIDS and AZT In a study (reported in the New York...Ch. 13 - Factors affecting first home purchase The table...Ch. 13 - Unemployment and GDP Refer to Exercise 13.67. When...Ch. 13 - Prob. 75CPCh. 13 - Prob. 76CPCh. 13 - Prob. 77CPCh. 13 - Prob. 78CPCh. 13 - Prob. 79CPCh. 13 - True or false: Slopes For data on y = college GPA,...Ch. 13 - Prob. 81CPCh. 13 - Lurking variable Give an example of three...Ch. 13 - Prob. 83CPCh. 13 - Prob. 84CPCh. 13 - Prob. 85CPCh. 13 - Logistic versus linear For binary response...Ch. 13 - Prob. 87CPCh. 13 - Prob. 88CPCh. 13 - Prob. 89CPCh. 13 - Prob. 90CPCh. 13 - Prob. 91CPCh. 13 - Prob. 92CPCh. 13 - Prob. 93CP
Knowledge Booster
Background pattern image
Statistics
Learn more about
Need a deep-dive on the concept behind this application? Look no further. Learn more about this topic, statistics and related others by exploring similar questions and additional content below.
Recommended textbooks for you
  • Text book image
    Calculus For The Life Sciences
    Calculus
    ISBN:9780321964038
    Author:GREENWELL, Raymond N., RITCHEY, Nathan P., Lial, Margaret L.
    Publisher:Pearson Addison Wesley,
Text book image
Calculus For The Life Sciences
Calculus
ISBN:9780321964038
Author:GREENWELL, Raymond N., RITCHEY, Nathan P., Lial, Margaret L.
Publisher:Pearson Addison Wesley,
Statistics 4.1 Introduction to Inferential Statistics; Author: Dr. Jack L. Jackson II;https://www.youtube.com/watch?v=QLo4TEvBvK4;License: Standard YouTube License, CC-BY