
Concept explainers
Videos
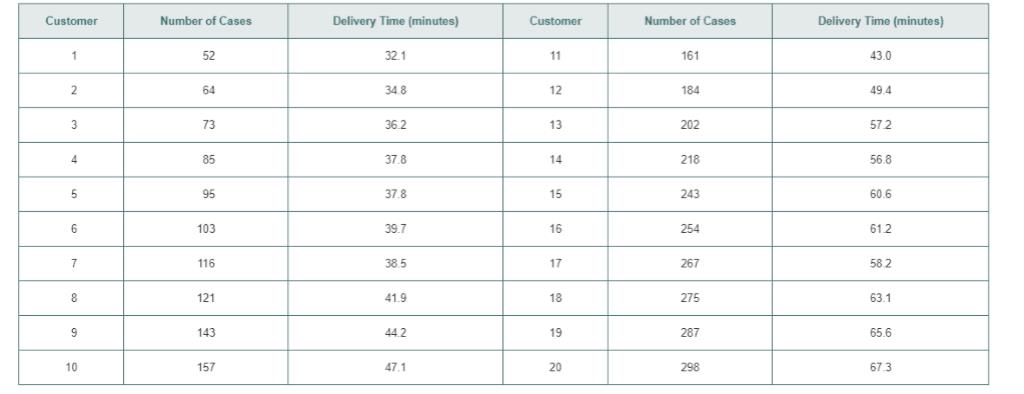
Management of a soft-drink botting company has the business objective of developing a method for allocating delivery costs to customers. Although one cost clearly relates to travel time within a particular route, another variable cost reflects the time required to unload the cases of soft drink at the delivery point. To begin, management decided to develop a regression model to predict delivery time based on the number of cases delivered. A sample of 20 deliveries within a territory was selected. The delivery times and the number of cases delivered were organized in the following table and stored in Delivery.
a. Use the least-squares method to compute the regression coefficients
b. Interpret the meaning of
c. Predict the
d. Should you use the model to predict the delivery time for a customer who is receiving 500 cases of soft drink? Why or why not?
e. Determine the coefficient of determination,
f. Perform a residual analysis. Is there any evidence of a pattern in the residuals? Explain.
g. At the 0.05 level of significance, is there evidence of a linear relationship between delivery time and the number of cases delivered?
h. Construct a
i. What conclusions can you reach from (a) through (h) about the relationship between the number of cases and delivery time?
Want to see the full answer?
Check out a sample textbook solution
Chapter 13 Solutions
Basic Business Statistics, Student Value Edition


- A magazine publishes restaurant ratings for various locations around the world. The magazine rates the restaurants for food, decor, service, and the cost per person. Develop a regression model to predict the cost per person, based on a variable that represents the sum of the three ratings. The magazine has compiled the accompanying table of this summated ratings variable and the cost per person for 25 restaurants in a major city. Predict the mean cost per person for a restaurant with a summated rating of 70.arrow_forwardThe general manager of an engineering firm wants to know whether a technical artist's experience influences the quality of his or her work. A random sample of 24 artists is selected and their years of work experience and quality rating (as assessed by their supervisors) recorded. Work experience (EXPER) is measured in years and quality rating (RATING) takes a value of 1 through 7, with 7 = excellent and 1 = poor. The simple regression model RATING = ẞ1 + ẞ₂EXPER+ € is proposed. The least squares estimates of the model, and the standard errors of the estimates, are RATING= 3.204 +0.076EXPER (se) (0.709) (0.044) (a) Interpret the coefficient of EXPER. (b) Construct a 95% confidence interval for B2, the slope of the relationship between quality rating and experience. In what are you 95% confident? (c) Test the null hypothesis that ẞ2 is zero against the alternative that it is not using a two-tail test and the α = 0.05 level of significance. What do you conclude? (d) Test the null…arrow_forwardConsumer Reports tested 19 different brands and models of road, fitness, and comfort bikes. Road bikes are designed for long road trips; fitness bikes are designed for regular workouts or daily commuters; and comfort bikes are designed for leisure rides on typically flat roads. The data file Bikes show the type, weight (lb.), and price ($) for the 20 bicycles tested. Develop an estimated regression equation that can be used to predict Price by using Type and Weight. Brand and Model Type Weight Price Klein Rêve v Road 20 1800 Giant OCR Composite 3 Road 22 1800 Giant OCR 1 Road 22 1000 Specialized Roubaix Road 21 1300 Trek Pilot 2.1 Road 21 1320 Cannondale Synapse 4 Road 21 1050 LeMond Poprad Road 22 1350 Raleigh Cadent 1.0 Road 24 650 Giant FCR3 Fitness 23 630 Schwinn Super Sport GS Fitness 23 700 Fuji Absolute 2.0 Fitness 24 700 Jamis Coda Comp Fitness 26 830 Cannondale Road Warrior 400 Fitness 25 700 Schwinn Sierra GS Comfort 31 340 Mongoose…arrow_forward
- Bill wants to explore factors affecting work stress. He would like to examine the relationship between age, number of years at the workplace, perceived social support, and work stress. He collects data on the variables from 100 employees (males and females) working in banks. The research question is How accurately can work stress be predicted from linear combination of the predictors (age, social support, number of years at the workplace)? Conduct a multiple regression analysis to answer the following questions: What is the relationship of age, number of years, and social support with work stress? Is the regression significant? If yes, what does it indicate?arrow_forwardBill wants to explore factors affecting work stress. He would like to examine the relationship between age, number of years at the workplace, perceived social support, and work stress. He collects data on the variables from 100 employees (males and females) working in banks. The research question is How accurately can work stress be predicted from linear combination of the predictors (age, social support, number of years at the workplace)? Conduct a multiple regression analysis to answer the following questions: What is the regression equation for all the predictors? Write a results section based on your analysis that answers the research question.arrow_forwardIn a study of housing demand, the county assessor is interested in developing a regression model to estimate the market value (i.e., selling price) of residential property within his jurisdiction. The assessor feels that the most important variable affecting selling price (measured in thousands of dollars) is the size of house (measured in hundreds of square feet). He randomly selected 15 houses and measured both the selling price and size, as shown in the following table. OBSERVATIONi SELLING PRICE (× $1,000)Y SIZE (× 100 ft2 )X 1 2 3 4 5 6 7 8 9 10 11 12 13 14 15 265.2 279.6 311.2 328.0 352.0 281.2 288.4 292.8 356.0 263.2 272.4 291.2 299.6 307.6 320.4 12.0 20.2 27.0 30.0 30.0 21.4 21.6 25.2 37.2 14.4 15.0 22.4 23.9 26.6 30.7 a. Plot the data.b. Determine the estimated regression line. Give an economic interpretation of the estimated slope (b) coefficient.c. Determine if size is a statistically significant variable in estimating selling price.d. Calculate the coefficient…arrow_forward
- An important application of regression analysis in accounting is in the estimation of cost. By collecting data on volume and cost and using the least squares method to develop an estimated regression equation relating volume and cost, an accountant can estimate the cost associated with a particular manufacturing volume. Consider the following sample of production volumes and total cost data for a manufacturing operation.arrow_forwardThe St. Lucian Government is interested in predicting the number of weekly riders on the public buses using the following variables: • • • • Price of bus trips per weekThe population in the cityThe monthly income of ridersAverage rate to park your personal vehicle Determine the multiple regression equation for the data. What is the predicted value of the number of weekly riders if: price of bus trips per week = $24; population = $2,000,000; the monthly income of riders = $13,500; and average rate to park your personal vehicle = $150. Interpret the coefficient of determination.arrow_forwardIn a study of housing demand, the county assessor develops the following regression model to estimate the market value (i.e., selling price) of residential property within his jurisdiction. The assessor suspects that important variables affecting selling price (YY, measured in thousands of dollars) are the size of a house (X1X1, measured in hundreds of square feet), the total number of rooms (X2X2), age (X3X3), and whether or not the house has an attached garage (X4X4, No=0, Yes=1No=0, Yes=1). Y=α+β1X1+β2X2+β3X3+β4X4+εY=α+β1X1+β2X2+β3X3+β4X4+ε Now suppose that the estimate of the model produces following results: a=166.048a=166.048, b1=3.459b1=3.459, b2=8.015b2=8.015, b3=−0.319b3=−0.319, b4=1.186b4=1.186, sb1=1.079sb1=1.079, sb2=5.288sb2=5.288, sb3=0.789sb3=0.789, sb4=12.252sb4=12.252, R2=0.838R2=0.838, F-statistic=12.919F-statistic=12.919, and se=13.702se=13.702. Note that the sample consists of 15 randomly selected observations. According to the estimated model, holding all…arrow_forward
 Linear Algebra: A Modern IntroductionAlgebraISBN:9781285463247Author:David PoolePublisher:Cengage Learning
 Calculus For The Life SciencesCalculusISBN:9780321964038Author:GREENWELL, Raymond N., RITCHEY, Nathan P., Lial, Margaret L.Publisher:Pearson Addison Wesley,
 Glencoe Algebra 1, Student Edition, 9780079039897...AlgebraISBN:9780079039897Author:CarterPublisher:McGraw Hill
 Big Ideas Math A Bridge To Success Algebra 1: Stu...AlgebraISBN:9781680331141Author:HOUGHTON MIFFLIN HARCOURTPublisher:Houghton Mifflin Harcourt