
Concept explainers
Videos
a.
Find the regression equation.
Find the selling price of a home with an area of 2,200 square feet.
Construct a 95% confidence interval for all 2,200 square foot homes.
Construct a 95% prediction interval for the selling price of a home with 2,200 square feet.
a.
Answer to Problem 62DE
The regression equation is
The selling price of a home with an area of 2,200 square feet is $219,429.30.
The 95% confidence interval for all 2,200 square foot homes is
The 95% prediction interval for the selling price of a home with 2,200 square feet is
Explanation of Solution
Here, the selling price is the dependent variable and size of the home is the independent variable.
Step-by-step procedure to obtain the ‘regression equation’ using MegaStat software:
- In an EXCEL sheet enter the data values of x and y.
- Go to Add-Ins > MegaStat >
Correlation /Regression >Regression Analysis . - Select input
range as ‘Sheet1!$B$2:$B$106’ under Y/Dependent variable. - Select input range ‘Sheet1!$A$2:$A$106’ under X/Independent variables.
- Select ‘Type in predictor values’.
- Enter 2,200 as ‘predictor values’ and 95% as ‘confidence level’.
- Click on OK.
Output obtained using MegaStat software is given below:
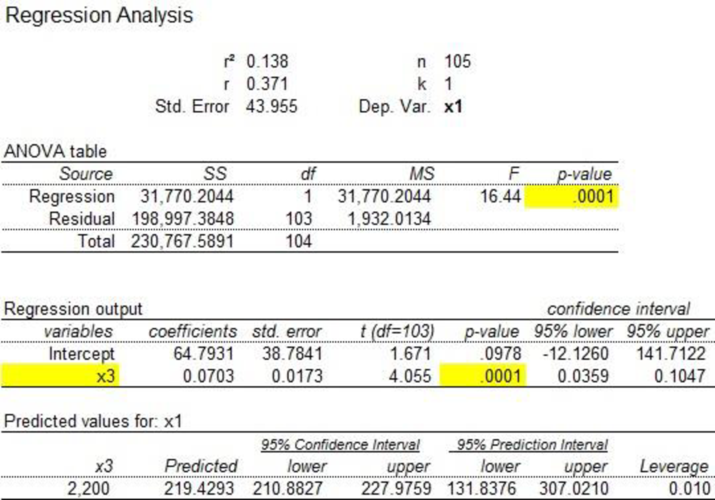
From the regression output, the regression equation is as follows.
Where y is the selling price and x is the size of the home.
The selling price of a home with an area of 2,200 square feet is $219,429.30.
The 95% confidence interval for all 2,200 square foot homes is
The 95% prediction interval for the selling price of a home with 2,200 square feet is
b.
Find the regression equation.
Find the selling price of a home with 20 miles from the center of the city.
Construct a 95% confidence interval for homes with 20 miles from the center of the city.
Construct a 95% prediction interval a home with 20 miles from the center of the city.
b.
Answer to Problem 62DE
The regression equation is
The estimated selling price of a home with 20 miles from the center of the city is $203087.10.
The 95% confidence interval for homes with 20 miles from the center of the city is
The 95% prediction interval for homes with 20 miles from the center of the city is
Explanation of Solution
Step-by-step procedure to obtain the ‘regression equation’ using MegaStat software:
- In an EXCEL sheet enter the data values of x and y.
- Go to Add-Ins > MegaStat > Correlation/Regression > Regression Analysis.
- Select input range as ‘Sheet1!$C$2:$C$106’ under Y/Dependent variable.
- Select input range ‘Sheet1!$B$2:$B$106’ under X/Independent variables.
- Select ‘Type in predictor values’.
- Enter 20 as ‘predictor values’ and 95% as ‘confidence level’.
- Click on OK.
Output obtained using MegaStat software is given below:

From the above output, the regression equation is as follows:
Where y is the selling price of a home and x is the distance from the center of the city.
The estimated selling price of a home with 20 miles from the center of the city is $203087.10.
The 95% confidence interval for homes with 20 miles from the center of the city is
The 95% prediction interval for a home with 20 miles from the center of the city is
c.
Check whether there is a
Check whether there is a
Report the p-value of the test and summarize the results.
c.
Answer to Problem 62DE
There is a negative association between “distance from the center of the city” and “selling price”.
There is a positive association between “selling price” and “area of the home”.
Explanation of Solution
Denote the population correlation as
The null and alternative hypotheses are stated below:
Null hypothesis:
That is, the correlation between “distance from the center of the city” and “selling price” is greater than or equal to zero.
Alternative hypothesis:
That is, the correlation between “distance from the center of the city” and “selling price” is less than zero.
Here, the sample size is 105 and the
The test statistic is as follows:
Thus, the test statistic value is –3.75.
The degrees of freedom is as follows:
The level of significance is 0.05. Therefore,
Critical value:
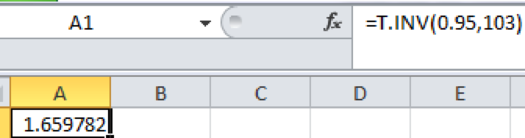
Step-by-step software procedure to obtain the critical value using EXCEL software:
- Open an EXCEL file.
- In cell A1, enter the formula “=T.INV (0.95, 103)”.
Output obtained using EXCEL is given as follows:
Decision rule:
Reject the null hypothesis H0, if
Conclusion:
The value of test statistic is –3.75 and the critical value is 1.659.
Here,
By the rejection rule, reject the null hypothesis.
Thus, it can be concluded that there is a negative association between“distance from the center of the city” and “selling price”.
Calculation of p-value:
Using excel formula = T.DIST (–3.75,103,TRUE)
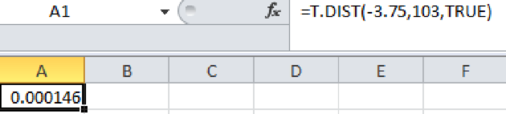
The p-value of the test is 0.000.
Check the correlation between independent variables “area of the home” and “selling price” is positive:
The hypotheses are given below:
Null hypothesis:
That is, the correlation between “size of the home” and “selling price” is less than or equal to zero.
Alternative hypothesis:
That is, the correlation between “size of the home” and “selling price” is positive.
Here, the sample size is 105 and the correlation coefficient is 0.371.
The test statistic is as follows:
Thus, the t-test statistic value is 3.76.
Conclusion:
The value of test statistic is 3.76 and the critical value is 1.659.
Here,
By the rejection rule, reject the null hypothesis.
Thus, it can be concluded that there is a positive association between “size of the home” and “selling price”.
Calculation of p-value:
Using excel formula = T.DIST (3.76,103,TRUE)
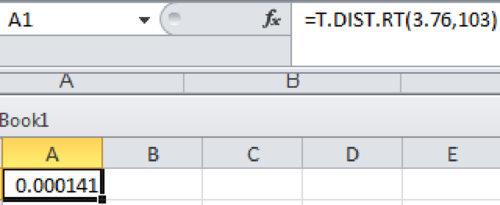
The p-value of the test is 0.000141.
Want to see more full solutions like this?
Chapter 13 Solutions
Statistical Techniques in Business and Economics


 Glencoe Algebra 1, Student Edition, 9780079039897...AlgebraISBN:9780079039897Author:CarterPublisher:McGraw Hill
 Big Ideas Math A Bridge To Success Algebra 1: Stu...AlgebraISBN:9781680331141Author:HOUGHTON MIFFLIN HARCOURTPublisher:Houghton Mifflin Harcourt
 Holt Mcdougal Larson Pre-algebra: Student Edition...AlgebraISBN:9780547587776Author:HOLT MCDOUGALPublisher:HOLT MCDOUGAL
 Functions and Change: A Modeling Approach to Coll...AlgebraISBN:9781337111348Author:Bruce Crauder, Benny Evans, Alan NoellPublisher:Cengage Learning