
Videos
Rainfall Refer to exercise 13.35, which discussed a study on the effects of cloud seeding to produce rainfall. Some researchers think that cloud seeding has little effect on “low rain potential” clouds. Instead, they claim, most of the action is with clouds that would produce lots of rain even without seeding. In this scenario, clouds that would produce little rain without seeding will produce little rain with seeding. However, the clouds that would produce the most rain without seeding will produce much, much more rain with cloud seeding. To test this, researchers carried out a randomization test to find out whether the third
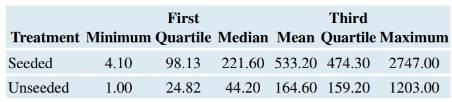
a. Explain what it means to say that the third quartile of rainfall is 474.30 acre-feet.
b. Why is the third quartile an appropriate statistic to answer the research-ers’ question?
c. What is the observed difference in third-quartile rainfall between the seeded and unseeded clouds?
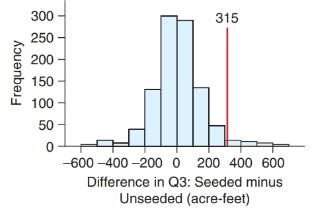
d. To determine whether such differences could occur by chance, a statistician could have written the 52 rainfall amounts on separate slips of paper and randomly dealt them into two stacks. He or she would then have computed the third quartile of each stack and found the difference. A computer actually did this 1000 times, each time finding the difference between the third quartile for the seeded clouds minus the third quartile for the unseeded clouds. The results are shown in the histogram. Referring to the histogram, carry out a hypothesis test to test whether cloud seeding increased the third-quartile rainfall. (You will have to get approximate
Want to see the full answer?
Check out a sample textbook solution
Chapter 13 Solutions
Introductory Statistics (2nd Edition)
Additional Math Textbook Solutions
Statistics for Psychology
Introductory Statistics
Probability and Statistics for Engineering and the Sciences
Elementary Statistics ( 3rd International Edition ) Isbn:9781260092561
The Practice of Statistics for AP - 4th Edition
Elementary Statistics (Text Only)


- What does the y -intercept on the graph of a logistic equation correspond to for a population modeled by that equation?arrow_forwardDairy cattle are cattle that are bred for their ability to produce large quantities of milk. Lameness is a condition that can be detrimental to cattle since it can be painful and result in deleterious effects on the animal’s welfare. It is a condition in which cows have difficulty moving and especially walking. Investigators are interested in whether milk production in dairy cows is associated with whether or not the cow becomes lame. They think that the age of the cow (young or old) may confound and/or modify the relationship between milk production and lameness and so they collect information on the age of the cows as well. The data that cross classifies lame status and milk production status is stratified by age and provided in the tables below. Use SAS to complete each part. (a) Ignoring age, report the estimate for the OR and its corresponding 95% confidence interval. Interpret both. (b) Ignoring age, is milk production associated with lameness? Justify your response using a…arrow_forwardDetermine the hypothesis using apa formatarrow_forward
- TABLE 10.2 A course can be taken for credit either by attending lecture sessions at fixed times and days, or by doing online sessions that can be done at the student's own pace and at those times the student chooses. The course coordinator wants to determine if these two ways of taking the course resulted in a significant difference in achievement as measured by the final exam for the course. Table 10.2 gives the scores on an exami- nation with 45 possible points for one group of n₁ = 9 students who took the course online, and a second group of n₂ = 9 students who took the course with conventional lectures. Do these data present sufficient evidence to indicate that the average grade for students who take the course online is significantly higher than for those who attend a conventional class? Test Scores for Online and Classroom Presentations Online Classroom 32 37 35 28 41 44 35 31 34 35 31 29 25 34 40 27 32 31arrow_forwardPlease show your work for part a- darrow_forwardTwo of the hottest smartphones on the market are the newly released iPhone6 and the Samsung Galaxy S6. CNet.com offers online reviews of all major cell phones, including battery life tests. In a review of the iPhone6, the talk-time battery life of 35 iPhones was measured. Similarly, the talk-time battery life of 30 Galaxy S6s was measured. Two outputs are given below. Which is appropriate for analyzing the data collected? Output 1 Output 2 Using the StatCrunch output chosen above, determine if there is a difference in the mean battery life for the two phones. Use a significance level of 0.01 when conducting the test. Select the appropriate hypotheses. Make sure the notation used in the hypotheses agrees with the type of samples selected in the output. Ho:μd=0Ho:μd=0Ha:μd<0Ha:μd<0 Ho:μd=0Ho:μd=0Ha:μd≠0Ha:μd≠0 Ho:μd=0Ho:μd=0Ha:μd>0Ha:μd>0 Ho:μ1=μ2Ho:μ1=μ2Ha:μ1>μ2Ha:μ1>μ2 Ho:μ1=μ2Ho:μ1=μ2Ha:μ1≠μ2Ha:μ1≠μ2 Ho:μ1=μ2Ho:μ1=μ2Ha:μ1<μ2Ha:μ1<μ2 αα =…arrow_forward
- Muscle tension in the head region has been associated with tension headaches. Therefore, a physician reasoned that if the muscle tension could be reduced, perhaps the headaches would decrease or go away altogether. They design an experiment in which nine participants with tension headaches participate. The participants keep the logs of number of headaches experience during a two week baseline period. Then they are trained to lower their muscle tension in the head region, using a biofeedback device. For this experiment, the biofeedback device is connected to the frontalis muscle, a muscle in the forehead region. The device tells the participant the amount of tension in the muscle to which it is attached ( in this case, frontalis) and helps them achieve low tension levels. After six weeks of training, during which the participants have become successful at maintaining low frontalis muscle tension, They again keep a two week log of the number of headaches experience. The following are…arrow_forwardAn oil company plans to add a chemical to its gasoline to make it burn more cleanly. The company conducts an experiment to see whether adding the chemical affects the gasoline mileage of cars using their gasoline. State the null hypothesis for the experiment. Adding the chemical increases gas mileage. Adding the chemical does not affect gasoline mileage. Adding the chemical affects gasoline mileage. Adding the chemical decreases gasoline mileage.arrow_forwardIn a study, the effects of the mane of a male lion as a signal of quality to mates and rivals was explored. Four life-sized dummies of male lions provided a tool for testing female response to the unfamiliar lions whose manes varied by length (long or short) and color (blonde or dark). The female lions were observed to see whether they approached each of the four life-sized dummies. Complete parts (a) through (e) below. a. Identify the experimental units. Choose the correct answer below. The female lions The male dummies The mane colors The mane lengths Part 2 b. Identify the response variable. Choose the correct answer below. A. Whether or not (yes or no) the mane length affected how the female lions reacted to a male dummy. B. Whether or not (yes or no) the female lions approached the same dummies. C. Whether or not (yes or no) the female lions approached a male dummy. D. Whether or not…arrow_forward
- You want to find out whether caffeine mitigates the effect of alcohol on reaction time. To study this, you administer to your subjects a drink that is equivalent to three 12-ounce beers, followed by the equivalent of two cups of coffee. Then your subjects complete a simulated driving task in which they must follow a fixed speed limit while driving on a straight road. Wind periodically and randomly pushes the simulated vehicle right, left, or not at all. Speed is measured in miles per hour above or below the 60-mph speed limit, with 1 mph being the smallest unit on the scale. Suppose the first subject scores 5 mph. Determine the real limits of 5. 1)The lower real limit is: 2)The upper real limit is: When measuring weight on a scale that is accurate to the nearest 0.1 pound, what are the real limits for the weight of 120 pounds? a)119.75–120.25 b)120–121 c)119.95–120.05 When measuring weight on a scale that is accurate to the nearest…arrow_forwardIn his doctoral thesis, L. A. Beckel (University of Minnesota, 1982) studied the social behavior of river otters during the mating season. An important role in the bonding process of river otters is very short periods of social grooming. After extensive observations, Dr. Beckel found that one group of river otters under study had a frequency of initiating grooming of approximately 1.7 for each 10 minutes. Suppose that you are observing river otters for 30 minutes. Let r = 0, 1, 2, ... be a random variable that represents the number of times (in a 30-minute interval) one otter initiates social grooming of another. a) What is ?? b) Write out the formula for the probability distribution of the random variable r. P(r) = _________ c) Find the probability that one otter will initiate social grooming four or more times during the 30-minute observation period. (Round your answer to four decimal places.)arrow_forwardAmit Almor, a psychology researcher at the University of South Carolina, conducted a series of experiments on conversation and attention level. He found that subjects were four times more distracted while preparing to speak or speaking than when they were listening. This research has many implications, including those for the issue of using cell phones while driving. You decide to explore this issue by having three different groups try tracking a fast-moving target on a computer screen. The first group is preparing to speak, the second group is speaking, and the third group is listening to a conversation. The sample mean and sum of squares of the scores for each of the three groups are presented in the following table. Group Sample Mean Sum of Squares Preparing to speak 98.3 7,2810.0900 Speaking 101.5 6,6156.8100 Listening 103.2 70,277.7600 After collecting the data, you analyze the data using an ANOVA. The results of your analysis are presented in the following…arrow_forward
 Linear Algebra: A Modern IntroductionAlgebraISBN:9781285463247Author:David PoolePublisher:Cengage Learning
 Holt Mcdougal Larson Pre-algebra: Student Edition...AlgebraISBN:9780547587776Author:HOLT MCDOUGALPublisher:HOLT MCDOUGAL
 Glencoe Algebra 1, Student Edition, 9780079039897...AlgebraISBN:9780079039897Author:CarterPublisher:McGraw Hill
 Big Ideas Math A Bridge To Success Algebra 1: Stu...AlgebraISBN:9781680331141Author:HOUGHTON MIFFLIN HARCOURTPublisher:Houghton Mifflin Harcourt