Concept explainers
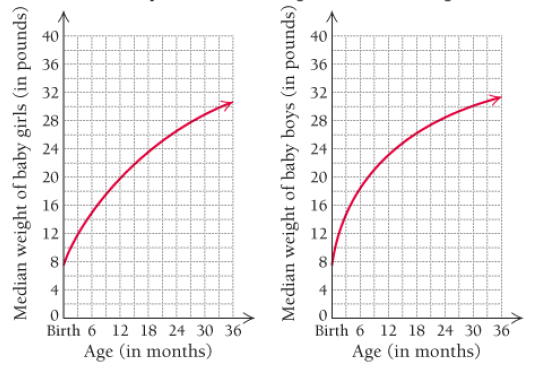
Growth of a baby. The median weights of babies at age t months are graphed below.

(Source; Developed by the National Center for Health Statistics in collaboration with the national Center for Chronic Disease Prevention and Health promotion, 2000; checked in 2004,)
Use the graph of girls’ median weight to estimate;
a) The average growth rate of a girl during her first 12 months. (Your answer should be in pounds per month.)
b) The average growth rate of a girl during her second 12 month.
c) The average growth rate of a girl during her first 24 months.
d) Based on your answers in parts (a)-(c) and the graph, estimate the growth rate of a typical 12-month-old girl, and explain how you arrived at this figure.
e) In What-three-month period does a baby girl grow fastest?
Trending nowThis is a popular solution!

Chapter 1 Solutions
Calculus and Its Applications (11th Edition)
Additional Math Textbook Solutions
Introductory Statistics
A First Course in Probability (10th Edition)
Elementary Statistics
College Algebra (7th Edition)
Thinking Mathematically (6th Edition)
College Algebra with Modeling & Visualization (5th Edition)
- Diagonalize the following matrix, if possible. 8 0 6 - 8 Select the correct choice below and, if necessary, fill in the answer box to complete your choice. 8 0 OA. For P= D= 0 3 6 0 B. For P = D= 0 -6 8 0 C. For P = D= 0 - 8 D. The matrix cannot be diagonalized.arrow_forwardCalculus lll May I please have the solutions for the following exercises? Thank youarrow_forwardCalculus lll May I please have the solution for the following question? Thank youarrow_forward
- Find three horizontal tangents between [0,10]arrow_forward4 In the integral dxf1dy (7)², make the change of variables x = ½(r− s), y = ½(r + s), and evaluate the integral. Hint: Find the limits on r and s by sketching the area of integration in the (x, y) plane along with the r and s axes, and then show that the same area can be covered by s from 0 to r and r from 0 to 1.arrow_forward7. What are all values of 0, for 0≤0<2л, where 2 sin² 0=-sin? - 5π 6 π (A) 0, л, and 6 7π (B) 0,л, 11π , and 6 6 π 3π π (C) 5π 2 2 3 , and π 3π 2π (D) 2' 2'3 , and 3 4元 3 1 די } I -2m 3 1 -3 บ 1 # 1 I 3# 3m 8. The graph of g is shown above. Which of the following is an expression for g(x)? (A) 1+ tan(x) (B) 1-tan (x) (C) 1-tan (2x) (D) 1-tan + X - 9. The function j is given by j(x)=2(sin x)(cos x)-cos x. Solve j(x) = 0 for values of x in the interval Quiz A: Topic 3.10 Trigonometric Equations and Inequalities Created by Bryan Passwaterarrow_forward
- can you solve this question using partial fraction decomposition and explain the steps used along the wayarrow_forwardIntegral How 80*1037 IW 1012 S е ऍ dw answer=0 How 70+10 A 80*1037 Ln (Iwl+1) du answer=123.6K 70*1637arrow_forwardcan you solve this question and explain the steps used along the wayarrow_forward
 College Algebra (MindTap Course List)AlgebraISBN:9781305652231Author:R. David Gustafson, Jeff HughesPublisher:Cengage Learning
 Glencoe Algebra 1, Student Edition, 9780079039897...AlgebraISBN:9780079039897Author:CarterPublisher:McGraw HillAlgebra & Trigonometry with Analytic GeometryAlgebraISBN:9781133382119Author:SwokowskiPublisher:Cengage
 Linear Algebra: A Modern IntroductionAlgebraISBN:9781285463247Author:David PoolePublisher:Cengage Learning
 Holt Mcdougal Larson Pre-algebra: Student Edition...AlgebraISBN:9780547587776Author:HOLT MCDOUGALPublisher:HOLT MCDOUGAL


