
Concept explainers
Videos
a.
Identify the dependent variable and independent variable.
a.
Answer to Problem 1SR
The dependent variable is the ‘sales revenue’ and the independent variable is the ‘advertising expense’.
Explanation of Solution
Data on the number of times the advertisement was aired and digital camera sales are given.
Independent variable:
The variable that can be used to predict the values of other variable is called an independent variable.
Dependent variable:
The variable that can be predicted by other variables is called a response variable or a dependent variable.
Here, the variable ‘sales revenue’ can be predicted using the variable ‘advertising expense’. Therefore, the dependent variable is the ‘sales revenue’ and the independent variable is the ‘advertising expense’.
b.
Construct a
b.
Answer to Problem 1SR
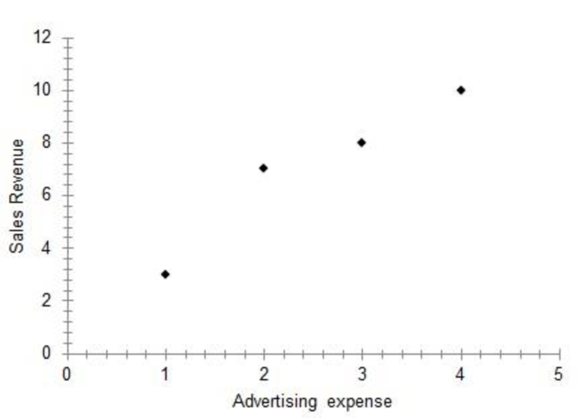
The scatter diagram of the data is represented below:
Explanation of Solution
Calculation:
The scatterplot of the data is as follows:
Software Procedure:
Step-by-step procedure to obtain the scatterplot using Mega Stat software:
- In an EXCEL sheet enter the data values of x and y.
- Go to Add-Ins > Mega Stat >
Correlation /Regression > Scatterplot. - Enter horizontal axis as $A$1:$A$5 and vertical axis as $B$1:$B$5.
- Click on OK.
The scatterplot of the data shows an increasing trend.
c.
Find the
c.
Answer to Problem 1SR
Thus, the correlation coefficient is 0.965.
Explanation of Solution
Calculation:
Software procedure:
Step-by-step procedure to obtain the correlation matrix using Mega Stat software:
- In an EXCEL sheet enter the data values of x and y.
- Go to Add-Ins > Mega Stat > Correlation/Regression > Correlation matrix.
- Enter Input
Range as $A$1:$b$5. - Click on OK.
Output obtained using Mega Stat is given as follows:
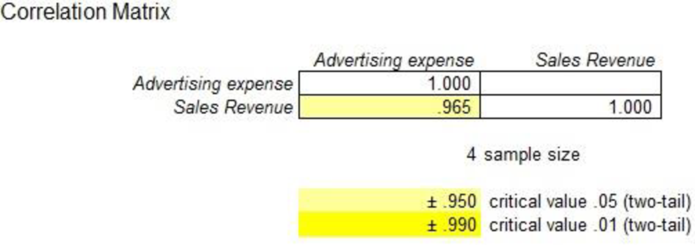
Thus, the correlation coefficient is 0.965.
d.
Interpret the strength of the correlation coefficient.
d.
Explanation of Solution
From Part (c), the correlation coefficient is 0.965. Since the correlation coefficient is positive and close to 1, there is a strong
Want to see more full solutions like this?
Chapter 13 Solutions
Statistical Techniques in Business and Economics, 16th Edition


- If you are performing a break-even analysis for a business and their cost and revenue equations are dependent, explain what this means for the company's profit margins.arrow_forwardStock Market The week of September 15, 2008 was one of the most volatile weeks ever for the US stock market. The closing numbers of the Dow Jones Industrial Average each day were: What was the overall change for the week? Was it positive or negative?arrow_forwardThe Conch Café, located in Gulf Shores, Alabama, features casual lunches with a great view of the Gulf of Mexico. To accommodate the increase in business during the summer vacation season, Fuzzy Conch, the owner, hires a large number of servers as seasonal help. When he interviews a prospective server, he would like to provide data on the amount a server can earn in tips. He believes that the amount of the bill and the number of diners are both related to the amount of the tip. He gathered the following sample information. Customer Amount of Tip Amount of Bill Number of Diners Customer Amount of Tip Amount of Bill Number of Diners 1 $ 7.00 $ 48.97 5 16 $ 3.30 $ 23.59 2 2 4.50 28.23 4 17 3.50 22.30 2 3 1.00 10.65 1 18 3.25 32.00 2 4 2.40 19.82 3 19 5.40 50.02 4 5 5.00 28.62 3 20 2.25 17.60 3 6 4.25 24.83 2 21 5.50 44.47 4 7 0.50 6.24 1 22 3.00 20.27 2…arrow_forward
- The Conch Café, located in Gulf Shores, Alabama, features casual lunches with a great view of the Gulf of Mexico. To accommodate the increase in business during the summer vacation season, Fuzzy Conch, the owner, hires a large number of servers as seasonal help. When he interviews a prospective server, he would like to provide data on the amount a server can earn in tips. He believes that the amount of the bill and the number of diners are both related to the amount of the tip. He gathered the following sample information. Customer Amount of Tip Amount of Bill Number of Diners Customer Amount of Tip Amount of Bill Number of Diners 1 $ 6.05 $ 73.22 1 16 $ 3.30 $ 23.59 2 2 4.50 28.23 4 17 3.50 22.30 2 3 1.00 10.65 1 18 3.25 32.00 2 4 2.40 19.82 3 19 5.40 50.02 4 5 5.00 28.62 3 20 2.25 17.60 3 6 4.25 24.83 2 21 1.40 41.80 5 7 .50 6.25 1 22 3.00 20.27 2…arrow_forwardBargain Rental Car wants to better understand the variable and fixed portions of its car washing costs. The company operates its own car wash facility that cleans each rental car before releasing it to another customer. Management believes the variable portion of its car washing costs relates to the number of rental returns. Accordingly, the following data have been compiled: Month January February March April May June July August September October November December Rental Returns 2,400 2,500 2,800 3,100 3,700 5,100 5,600 5,600 Fixed cost per month Variable cost per rental return 4,700 4,100 2,200 2,900 Exercise 5A-2 Part 2 (Algo) Car Wash Costs $ 11,300 $ 13,300 $ 12,100 $ 14,700 $ 16,500 $ 23,900 $ 22,500 $ 22,900 $ 23,100 $ 22,000 $ 11,000 $ 15,300 2. Using least-squares regression, estimate the variable cost per rental return and the monthly fixed cost incurred to wash cars. Note: Round Fixed cost to the nearest whole dollar amount and the Variable cost per unit to 2 decimal…arrow_forwardFor each problem, select the best response. (a) The Columbus Zoo conducts a study to determine whether a household's income can be used to predict the amount of money the household will give to the zoo's annual fund drive. The response variable in this study is A. the amount of money a household gives to the zoo's annual fund drive. B. all households in Columbus. C. the Columbus Zoo. D. a household's income. E. None of the above. (b) A researcher measures the correlation between two variables. This correlation tells us A. whether a cause-and-effect relation exists between two variables. B. the strength of a straight line relation between two variables. C. whether there is a relation between two variables. D. whether or not a scatterplot shows an interesting pattern. E. None of the above. (c) A researcher wishes to determine whether the rate of water flow (in liters per second) over an experimental soil bed can be used to predict the amount of soil washed away (in…arrow_forward
- If a household has 3 members, and has an annual income of $100,000, predict this household’s monthly spending.arrow_forwarde e e 24-15. The sales of a company rose from Rs. 40,000 in March to Rs. 48,000 in April 2002. The company's seasonal indices for these two months are 105 and 140 respectively. The owner of the company expressed dissatisfaction with the April sales, but the Sales Manager said that he was quite pleased with the Rs. 8,000 increase, What argument should the owner of the company have used to reply to the Sales Manager? The Sales Manager also predicted on the basis of the April sales that the total 2002 sales were going to be Rs. 5,76,000. Criticise the Sales Manager's estimate and explain how the estimate of Rs. 4,11,000 may be arrived at.arrow_forward[The following information applies to the questions displayed below.] Bargain Rental Car offers rental cars in an off-airport location near a major tourist destination in California. Management would like to better understand the variable and fixed portions of its car washing costs. The company operates its own car wash facility in which each rental car that is returned is thoroughly cleaned before being released for rental to another customer. Management believes that the variable portion of its car washing costs relates to the number of rental returns. Accordingly, the following data have been compiled: Month January February March April May June July August September October November December Rental Returns 2,400 Fixed cost per month Variable cost per rental return 2,500 2,700 3,000 3,600 5,000 5,500 5,400 4,700 3,900 2,200 2,700 Car Wash Costs $ 10,700 $ 13,000 $ 11,500 $ 13,800 $ 15,900 $ 22,700 $ 21,900 $ 21,400 $ 22,500 $ 20,200. $ 10,400 $ 13,200 Exercise 5A-2 Part 2 (Algo) 2.…arrow_forward
- Bargain Rental Car offers rental cars in an off-airport location near a major tourist destination in California. Management would like to better understand the variable and fixed portions of its car washing costs. The company operates its own car wash facility in which each rental car that is returned is thoroughly cleaned before being released for rental to another customer. Management believes that the variable portion of its car washing costs relates to the number of rental returns. Accordingly, the following data have been compiled: Month Rental Returns Car Wash Costs January 2,400 $ 11,300 February 2,500 $ 13,300 March 2,800 $ 12,100 April 3,100 $ 14,700 May 3,700 $ 16,500 June 5,100 $ 23,900 July 5,600 $ 22,500 August 5,600 $ 22,900 September 4,700 $ 23,100 October 4,100 $ 22,000 November 2,200 $ 11,000 December 2,900 $ 15,300 2. Using least-squares regression, estimate the variable cost per rental return and the monthly fixed cost incurred to wash cars. (Round Fixed cost to the…arrow_forwardDataware is trying to determine whether to give a $10 rebate, to cut the price $6, or to have no price change on a software product. Currently, 40,000 units of the product are sold each week for $45. The variable cost of the product is $5. The most likely case appears to be that a $10 rebate will increas e sales 30%, and half of all people will claim the rebate. For the price cut, the most likely case is that sales will increase 20%. a) Build the basic model to compute the profits of the three options. b) What increase in sales from the rebate would make the r ebate and price cut equally desirable? c) Dataware does not really know the increase in sales that will result from a rebate or price cut. However, the company is sure that the rebate will increase sales by between 15% and 40% and that the price cut will incr ease sales by between 10% and 30%. Perform a sensitivity analysis that could be used to help determine Dataware ’ s course of actionarrow_forwardThe following table shows the expenses and income for a local college student. Assume that amounts shown for salaries and wages are after taxes and that 1 month = 4 weeks. Income Expenses Part-time Job: $1100/month Rent: $550/month Student Loans: $8400/year Groceries: $50/week Scholarship: $5700/year Tuition and Fees: $7500/year Health Insurance: $40/month Entertainment: $40/week Phone: $65/month a) What is the student's monthly income? b) What is the student's monthly expenses? c) What is the student's net monthly cash flow?arrow_forward
 Elementary AlgebraAlgebraISBN:9780998625713Author:Lynn Marecek, MaryAnne Anthony-SmithPublisher:OpenStax - Rice University
 Glencoe Algebra 1, Student Edition, 9780079039897...AlgebraISBN:9780079039897Author:CarterPublisher:McGraw Hill