Concept explainers
Videos
a)
To determine: The optimal plan using the transportation method.
Introduction: Aggregate planning using transportation method helps to attain minimum cost using the optimal plan. The major advantage of transportation method is to achieve the optimal solution using optimal plans.
a)
Answer to Problem 17P
The optimal plan using the transportation method has been developed.
Explanation of Solution
Given information:
The following information has been given:
| Quarter |
| Regular time | Overtime | Subcontract |
| 1 | 500 | 400 | 80 | 100 |
| 2 | 750 | 400 | 80 | 100 |
| 3 | 900 | 800 | 160 | 100 |
| 4 | 450 | 400 | 80 | 100 |
Initial inventory is given as 250 units, regular time cost is $1 per unit, overtime cost is $1.50 per unit, and subcontract cost is $2 per unit. Carrying cost is given as $0.5 per unit per quarter and backorder cost is $0.5 per unit per quarter. Initial inventory would incur $0.2 per unit.
Develop optimal plan using transportation model:
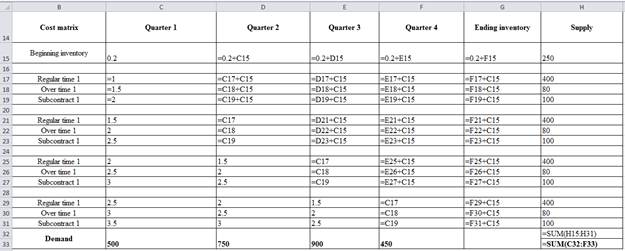
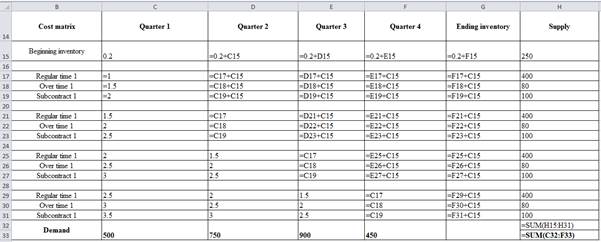
Develop cost matrix:
| Cost matrix | Quarter 1 | Quarter 2 | Quarter 3 | Quarter 4 | Ending inventory | Supply |
| Beginning inventory | 0.2 | 0.4 | 0.6 | 0.8 | 1 | 250 |
| Regular time 1 | 1 | 1.2 | 1.4 | 1.6 | 1.8 | 400 |
| Over time 1 | 1.5 | 1.7 | 1.9 | 2.1 | 2.3 | 80 |
| Subcontract 1 | 2 | 2.2 | 2.4 | 2.6 | 2.8 | 100 |
| Regular time 1 | 1.5 | 1 | 1.2 | 1.4 | 1.6 | 400 |
| Over time 1 | 2 | 1.5 | 1.7 | 1.9 | 2.1 | 80 |
| Subcontract 1 | 2.5 | 2 | 2.2 | 2.4 | 2.6 | 100 |
| Regular time 1 | 2 | 1.5 | 1 | 1.2 | 1.4 | 400 |
| Over time 1 | 2.5 | 2 | 1.5 | 1.7 | 1.9 | 80 |
| Subcontract 1 | 3 | 2.5 | 2 | 2.2 | 2.4 | 100 |
| Regular time 1 | 2.5 | 2 | 1.5 | 1 | 1.2 | 400 |
| Over time 1 | 3 | 2.5 | 2 | 1.5 | 1.7 | 80 |
| Subcontract 1 | 3.5 | 3 | 2.5 | 2 | 2.2 | 100 |
| Demand | 500 | 750 | 900 | 450 | 2570 | |
| 2600 |
Excel worksheet to generate the above table:
Develop optimal plan:
| Optimal plan | Quarter 1 | Quarter 2 | Quarter 3 | Quarter 4 | Ending inventory | Dummy |
| Beginning inventory | 100 | 150 | ||||
| Regular time 1 | 400 | |||||
| Over time 1 | 80 | |||||
| Subcontract 1 | 100 | |||||
| Regular time 1 | 400 | |||||
| Over time 1 | 80 | |||||
| Subcontract 1 | 100 | |||||
| Regular time 1 | 800 | |||||
| Over time 1 | 40 | 100 | 20 | |||
| Subcontract 1 | 100 | |||||
| Regular time 1 | 400 | |||||
| Over time 1 | 50 | 30 | ||||
| Subcontract 1 | 100 | |||||
| Demand | 500 | 750 | 900 | 450 |
The given demand and supply should be separated and the remaining supply and demand should be used as a dummy value.
b)
To determine: The total cost of the optimal plan.
Introduction: Aggregate planning using transportation method helps to attain minimum cost using the optimal plan. The major advantage of transportation method is to achieve the optimal solution using optimal plans.
b)
Answer to Problem 17P
The optimal cost of the plan is $2,641.
Explanation of Solution
Given information:
The following information has been given:
| Quarter | Forecast (units) | Regular time | Overtime | Subcontract |
| 1 | 500 | 400 | 80 | 100 |
| 2 | 750 | 400 | 80 | 100 |
| 3 | 900 | 800 | 160 | 100 |
| 4 | 450 | 400 | 80 | 100 |
Initial inventory is given as 250 units, regular time cost is $1 per unit, overtime cost is $1.50 per unit, and subcontract cost is $2 per unit. Carrying cost is given as $0.5 per unit per quarter and backorder cost is $0.5 per unit per quarter. Initial inventory would incur $0.2 per unit.
Develop optimal plan using transportation model:
Develop cost matrix:
| Cost matrix | Quarter 1 | Quarter 2 | Quarter 3 | Quarter 4 | Ending inventory | Supply |
| Beginning inventory | 0.2 | 0.4 | 0.6 | 0.8 | 1 | 250 |
| Regular time 1 | 1 | 1.2 | 1.4 | 1.6 | 1.8 | 400 |
| Over time 1 | 1.5 | 1.7 | 1.9 | 2.1 | 2.3 | 80 |
| Subcontract 1 | 2 | 2.2 | 2.4 | 2.6 | 2.8 | 100 |
| Regular time 1 | 1.5 | 1 | 1.2 | 1.4 | 1.6 | 400 |
| Over time 1 | 2 | 1.5 | 1.7 | 1.9 | 2.1 | 80 |
| Subcontract 1 | 2.5 | 2 | 2.2 | 2.4 | 2.6 | 100 |
| Regular time 1 | 2 | 1.5 | 1 | 1.2 | 1.4 | 400 |
| Over time 1 | 2.5 | 2 | 1.5 | 1.7 | 1.9 | 80 |
| Subcontract 1 | 3 | 2.5 | 2 | 2.2 | 2.4 | 100 |
| Regular time 1 | 2.5 | 2 | 1.5 | 1 | 1.2 | 400 |
| Over time 1 | 3 | 2.5 | 2 | 1.5 | 1.7 | 80 |
| Subcontract 1 | 3.5 | 3 | 2.5 | 2 | 2.2 | 100 |
| Demand | 500 | 750 | 900 | 450 | 2570 | |
| 2600 |
Excel worksheet to generate the above table:
Develop optimal plan:
| Optimal plan | Quarter 1 | Quarter 2 | Quarter 3 | Quarter 4 | Ending inventory | Dummy |
| Beginning inventory | 100 | 150 | ||||
| Regular time 1 | 400 | |||||
| Over time 1 | 80 | |||||
| Subcontract 1 | 100 | |||||
| Regular time 1 | 400 | |||||
| Over time 1 | 80 | |||||
| Subcontract 1 | 100 | |||||
| Regular time 1 | 800 | |||||
| Over time 1 | 40 | 100 | 20 | |||
| Subcontract 1 | 100 | |||||
| Regular time 1 | 400 | |||||
| Over time 1 | 50 | 30 | ||||
| Subcontract 1 | 100 | |||||
| Demand | 500 | 750 | 900 | 450 |
The given demand and supply should be splitted and the remaining supply and demand should be used as a dummy value.
Calculate the total optimal cost:
It is calculated by adding the multiple of values in the optimal plan table and the value in the cost matrix to the respective value.
Hence, the total optimal cost is $2,641.
c)
To determine: The number of units remained unused in regular time capacity.
Introduction: Aggregate planning using transportation method helps to attain minimum cost using the optimal plan. The major advantage of transportation method is to achieve the optimal solution using optimal plans.
c)
Answer to Problem 17P
No, the regular time capacity remains unused.
Explanation of Solution
Given information:
The following information has been given:
| Quarter | Forecast (units) | Regular time | Overtime | Subcontract |
| 1 | 500 | 400 | 80 | 100 |
| 2 | 750 | 400 | 80 | 100 |
| 3 | 900 | 800 | 160 | 100 |
| 4 | 450 | 400 | 80 | 100 |
Initial inventory is given as 250 units, regular time cost is $1 per unit, overtime cost is $1.50 per unit, and subcontract cost is $2 per unit. Carrying cost is given as $0.5 per unit per quarter and backorder cost is $0.5 per unit per quarter. Initial inventory would incur $0.2 per unit.
Develop optimal plan:
| Optimal plan | Quarter 1 | Quarter 2 | Quarter 3 | Quarter 4 | Ending inventory | Dummy |
| Beginning inventory | 100 | 150 | ||||
| Regular time 1 | 400 | |||||
| Over time 1 | 80 | |||||
| Subcontract 1 | 100 | |||||
| Regular time 1 | 400 | |||||
| Over time 1 | 80 | |||||
| Subcontract 1 | 100 | |||||
| Regular time 1 | 800 | |||||
| Over time 1 | 40 | 100 | 20 | |||
| Subcontract 1 | 100 | |||||
| Regular time 1 | 400 | |||||
| Over time 1 | 50 | 30 | ||||
| Subcontract 1 | 100 | |||||
| Demand | 500 | 750 | 900 | 450 |
The given demand and supply should be separated and the remaining supply and demand should be used as a dummy value.
Determine whether the regular time capacity remain unused:
From the above table, it is clear that no regular time capacity remains unused. All the regular time capacity has been used in respective quarters.
d)
To determine: The extent of backordering in units and dollars.
Introduction: Aggregate planning using transportation method helps to attain minimum cost using the optimal plan. The major advantage of transportation method is to achieve the optimal solution using optimal plans.
d)
Answer to Problem 17P
The total unit of the backordered is 40 units and the total cost of producing the backorders are $20.
Explanation of Solution
Given information:
The following information has been given:
| Quarter | Forecast (units) | Regular time | Overtime | Subcontract |
| 1 | 500 | 400 | 80 | 100 |
| 2 | 750 | 400 | 80 | 100 |
| 3 | 900 | 800 | 160 | 100 |
| 4 | 450 | 400 | 80 | 100 |
Initial inventory is given as 250 units, regular time cost is $1 per unit, overtime cost is $1.50 per unit, and subcontract cost is $2 per unit. Carrying cost is given as $0.5 per unit per quarter and backorder cost is $0.5 per unit per quarter. Initial inventory would incur $0.2 per unit.
Develop optimal plan:
| Optimal plan | Quarter 1 | Quarter 2 | Quarter 3 | Quarter 4 | Ending inventory | Dummy |
| Beginning inventory | 100 | 150 | ||||
| Regular time 1 | 400 | |||||
| Over time 1 | 80 | |||||
| Subcontract 1 | 100 | |||||
| Regular time 1 | 400 | |||||
| Over time 1 | 80 | |||||
| Subcontract 1 | 100 | |||||
| Regular time 1 | 800 | |||||
| Over time 1 | 40 | 100 | 20 | |||
| Subcontract 1 | 100 | |||||
| Regular time 1 | 400 | |||||
| Over time 1 | 50 | 30 | ||||
| Subcontract 1 | 100 | |||||
| Demand | 500 | 750 | 900 | 450 |
The given demand and supply should be separated and the remaining supply and demand should be used as a dummy value.
Determine the extent backordering in units and dollars:
The colored cell is the only cell in the optimal plan, which is used for backordering. Hence, the backordering in units is 40 units. It is given that backorder cost is $0.50 per unit per quarter.
Hence, the total unit backordered is 40 units and the total costs of producing the backorders are $20.
Want to see more full solutions like this?
Chapter 13 Solutions
EBK PRINCIPLES OF OPERATIONS MANAGEMENT


- Scenario 3 Ben Gibson, the purchasing manager at Coastal Products, was reviewing purchasing expenditures for packaging materials with Jeff Joyner. Ben was particularly disturbed about the amount spent on corrugated boxes purchased from Southeastern Corrugated. Ben said, I dont like the salesman from that company. He comes around here acting like he owns the place. He loves to tell us about his fancy car, house, and vacations. It seems to me he must be making too much money off of us! Jeff responded that he heard Southeastern Corrugated was going to ask for a price increase to cover the rising costs of raw material paper stock. Jeff further stated that Southeastern would probably ask for more than what was justified simply from rising paper stock costs. After the meeting, Ben decided he had heard enough. After all, he prided himself on being a results-oriented manager. There was no way he was going to allow that salesman to keep taking advantage of Coastal Products. Ben called Jeff and told him it was time to rebid the corrugated contract before Southeastern came in with a price increase request. Who did Jeff know that might be interested in the business? Jeff replied he had several companies in mind to include in the bidding process. These companies would surely come in at a lower price, partly because they used lower-grade boxes that would probably work well enough in Coastal Products process. Jeff also explained that these suppliers were not serious contenders for the business. Their purpose was to create competition with the bids. Ben told Jeff to make sure that Southeastern was well aware that these new suppliers were bidding on the contract. He also said to make sure the suppliers knew that price was going to be the determining factor in this quote, because he considered corrugated boxes to be a standard industry item. As the Marketing Manager for Southeastern Corrugated, what would you do upon receiving the request for quotation from Coastal Products?arrow_forwardScenario 3 Ben Gibson, the purchasing manager at Coastal Products, was reviewing purchasing expenditures for packaging materials with Jeff Joyner. Ben was particularly disturbed about the amount spent on corrugated boxes purchased from Southeastern Corrugated. Ben said, I dont like the salesman from that company. He comes around here acting like he owns the place. He loves to tell us about his fancy car, house, and vacations. It seems to me he must be making too much money off of us! Jeff responded that he heard Southeastern Corrugated was going to ask for a price increase to cover the rising costs of raw material paper stock. Jeff further stated that Southeastern would probably ask for more than what was justified simply from rising paper stock costs. After the meeting, Ben decided he had heard enough. After all, he prided himself on being a results-oriented manager. There was no way he was going to allow that salesman to keep taking advantage of Coastal Products. Ben called Jeff and told him it was time to rebid the corrugated contract before Southeastern came in with a price increase request. Who did Jeff know that might be interested in the business? Jeff replied he had several companies in mind to include in the bidding process. These companies would surely come in at a lower price, partly because they used lower-grade boxes that would probably work well enough in Coastal Products process. Jeff also explained that these suppliers were not serious contenders for the business. Their purpose was to create competition with the bids. Ben told Jeff to make sure that Southeastern was well aware that these new suppliers were bidding on the contract. He also said to make sure the suppliers knew that price was going to be the determining factor in this quote, because he considered corrugated boxes to be a standard industry item. Is Ben Gibson acting legally? Is he acting ethically? Why or why not?arrow_forwardCorral Cartage leases trucks to service its shipping contracts. Larger trucks have cheaper operating costs if there is sufficient business, but are more expensive if they are not full. CC has estimates of monthly shipping demand. What comparison method(s) would be appropriate for choosing which trucks to lease?arrow_forward
- Acadia Logistics anticipates that it will need more distribution center space to accommodate what it believes will be a significant increase in demand for its final-mile services. Acadia could either lease public warehouse space to cover all levels of demand or construct its own distribution center to meet a specified level of demand, and then use public warehousing to cover the rest. The yearly cost of building and operating its own facility, including the amortized cost of construction, is $15.00 per square foot. The yearly cost of leasing public warehouse space is $24.50 per square foot. E Click the icon to view the expected demand requirements. a. The expected value of leasing public warehouse space as required by demand is $ 10290000 . (Enter your response as a whole number.) b. The expected value of building a 230,000-square-foot distribution center and leasing public warehouse space as required if demand exceeds the need for 230,000 square feet of space is $ (Enter your response…arrow_forwardAcadia Logistics anticipates that it will need more distribution center space to accommodate what it believes will be a significant increase in demand for its final-mile services. Acadia could either lease public warehouse space to cover all levels of demand or construct its own distribution center to meet a specified level of demand, and then use public warehousing to cover the rest. The yearly cost of building and operating its own facility, including the amortized cost of construction, is $15.00 per square foot. The yearly cost of leasing public warehouse space is $24.50 per square foot. E Click the icon to view the expected demand requirements. a. The expected value of leasing public warehouse space as required by demand is S (Enter your response as a whole number.) More Info Requirements (in sq. ft) Probability 230,000 430,000 630,000 830,000 0.35 0.4 0.2 0.05 Print Donearrow_forward1. A company would like to develop an aggregate plan and evaluate its cost using the transportation method. Solve using Excel of the QM software. Note: do not do this manually Related data are shown in the tables below Demand forecast Period Demand (Unit) 1 80 2 90 3 40 Supply Capacity available (units) Regular time 40 65 30 Period 1 2 3 Other Data Beginning Inventory Regular-time cost per unit Overtime cost per unit Subcontract cost per unit Carrying cost Overtime 20 12 10 30 R 100 R 150 R 200 R 5 Subcontract 10 5 5arrow_forward
- 3 Problems seen in the situation of the Company: 1. It does not earn too much but it makes sales enough for maintenance, salaries, income, and savings. 2. Company B makes use of a traditional inventory wherein they manually count their stocks and money. 3. They only have one supplier for liquors. For other supplies which are accessible, they usually buy from the wet market nearby. Proposed Solutions: Solution for no. 1- Digital marketing Solution for no. 2 – Perpetual Inventory System Solution for no. 3 – Supplier Quality Management System Hello, can someone help me? How am I going to create a decomposition diagram for these three solutions?arrow_forwardRam Roy's firm has developed the following supply, demand, cost, and inventory data. Allocate production capacity to meet demand at a minimum cost using the transportation method. What is the cost? Assume that the initial inventory has no holding cost in the first period and backorders are not permitted. supply available period initial inventory regular-time cost per unit Overtime cost per unit subcointract cost per unit carrying cost per unit per month 1 2 3 Regular Tim overtime subcontrac demand forecast 30 35 30 15 $ LA LA LA L $ $ $ 90.00 110.00 120.00 3.00 15 10 10 5 5 5 50 50 40arrow_forwardAfter applying the NWC Rule for the initial tableau of the given transportation model, evaluate the vacant cells. What is the cell which has the most negative evaluation value and what is the cell evaluation value? DESTINATION SOURCE DEMAND X Y N OX-R; 1 OY-S; -1 OX-S; -1 OY-S; -2 P 75 8 12 EI 11 Q 80 5 8 11 R 120 7 10 10 S 50 11 13 14 SUPPLY 100 125 100 325arrow_forward
- Ram Roy’s firm has developed the following supply, demand, cost, and inventory data. Allocate production capacity to meet demand at a minimum cost using the transportation method. What is the cost? Assume that the initial inventory has no holding cost in the first period and backorders are not permitted. Initial Inventory 20 Units Regular Time cost per unit $100 Overtime cost per unit $160 Sub contract cost per unit $250 Carrying cost per unit per month $6 Supply Table Period Regular Time Overtime Subcontract Demand Forecast 1 30 15 5 40 2 30 15 5 45 3 40 15 5 55arrow_forward. The Newcoat Painting Company has for some time been experiencing high demand for its automobile repainting service. Because it has had to turn away business, management is concerned that the limited space available to store cars awaiting painting has cost them in lost revenue. A small vacant lot next to the painting facility has recently been made available for rental on a long-term basis at a cost of $10 per day. Management believes that each lost customer costs $20 in profit. Current demand is estimated to be 21 cars per day with exponential interarrival times (including those turned away), and the facility can service at an exponential rate of 24 cars per day. Cars are processed on a FCFS basis. Waiting space is now limited to 9 cars but can be increased to 20 cars with the lease of the vacant lot.Newcoat wants to determine whether the vacant lot should be leased. Management also wants to know the expected daily lost profit due to turning away customers if the lot is leased. Only…arrow_forwardJordan Airline routinely overbooks its flights from Dallas to Florida. Overbooking discounted seats can be expensive because providing a bumped passenger with a last-minute flight on a competing carrier can cost $2,200. A 150-passenger jet costs about $150,000 to operate from Raleigh to Atlanta. The average ticket price is $2,000. Table. The frequency of no-shows NO-SHOWS FREQUENCY 1 15 2 10 3 10 4 5 5 5 6 5 a. how many seats should be overbooked? (show your calculations) b. Korean Airline increased the average ticket price from $2,000 to $3,000 on its Atlanta/Seoul route for the holidays. How would the increased ticket price affect the number of seats overbooked? (show your calculations)arrow_forward
 Practical Management ScienceOperations ManagementISBN:9781337406659Author:WINSTON, Wayne L.Publisher:Cengage,
 Purchasing and Supply Chain ManagementOperations ManagementISBN:9781285869681Author:Robert M. Monczka, Robert B. Handfield, Larry C. Giunipero, James L. PattersonPublisher:Cengage Learning