
Concept explainers
Videos
a.
To find: The equation of the fitted least-squares line
a.
Explanation of Solution
Given:
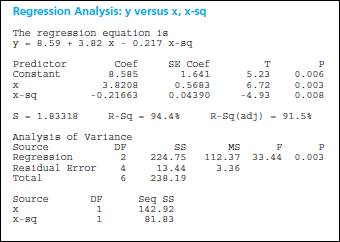
The Minitab output is:
Plot is:
From the provided output, the equation of the regression line is:
a.
To interpret: The value of
a.
Explanation of Solution
From the provided output, the coefficient of determination is 0.944. It means that 99.8% of the variation in the model is explained. Since, the value is large enough it means that the provided model is fit enough.
c.
To find: Whether the model is significant at 5% level of significance.
c.
Explanation of Solution
From the provided excel output; the p -value is equal to 0.000 which implies that the regression model is highly significant.
c.
To find: Whether there is sufficient evidence to show that the quadratic model provides a better fir to the data than a simple linear model.
c.
Explanation of Solution
The prediction equation relating
d.
To find: The number of defective items produced for an operator whose average output per hour is 25 and whose machine was serviced 3 weeks ago.
d.
Explanation of Solution
Since, the p -value is less than the level of significance. Thus, it could be said that the quadratic model provided a better fit than a simple linear model
e.
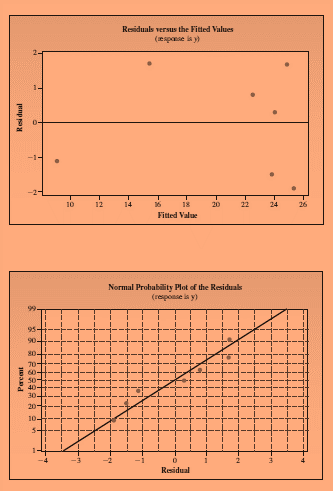
To explain: Whether normality assumptions have been violated using the residual plot.
e.
Explanation of Solution
From the provided residual plot, it could be said that there is no violation of normality assumptions. It means that model is well fitted.
Want to see more full solutions like this?
Chapter 13 Solutions
Introduction to Probability and Statistics


 Glencoe Algebra 1, Student Edition, 9780079039897...AlgebraISBN:9780079039897Author:CarterPublisher:McGraw Hill