
Understandable Statistics: Concepts and Methods
12th Edition
ISBN: 9781337119917
Author: Charles Henry Brase, Corrinne Pellillo Brase
Publisher: Cengage Learning
expand_more
expand_more
format_list_bulleted
Concept explainers
Videos
Textbook Question
Chapter 1.3, Problem 11P
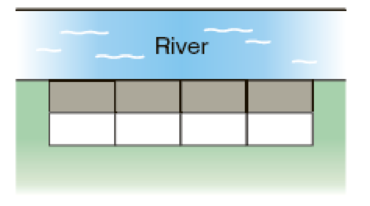
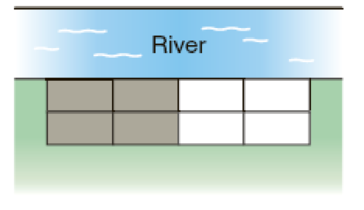
Critical Thinking An agricultural study is comparing the harvest volume of two types of barley. The site for the experiment is bordered by a river. The field is divided into eight plots of approximately the same size. The experiment calls for the plots to be blocked into four plots per block. Then, two plots of each block will be randomly assigned to one of the two barley types.
Two blocking schemes are shown below, with one block indicated by the white region and the other by the gray region. Which blocking scheme, A or B, would be better? Explain.
Scheme A
Scheme B
Expert Solution & Answer

Trending nowThis is a popular solution!

Students have asked these similar questions
A biologist is studying the plant diversity in 15 million acres of the Sierra Nevada Mountains. He
will count the number of species in 150 acres. Match the strategies to their corresponding
sampling techniques.
The biologist goes to his 150 favorite hiking places and looks at an acres along
each trail.
v The biologist enters the 15 million acres into a data base and had a computer
randomly select 150 of these acres.
The biologist classifies the Sierras into 10 different ecological types and then
makes sure that the proportion of each ecological type from the sample is the same as
the proportion of that of the population.
The biologist orders the 15 million acres by latitude and then surveys every
100000th acre on the list.
| The biologist goes to 15 diverse locations that have 10 acres each and surveys
all 10 acres for each of these 15 locations.
a. Convenience Sampling
b. Cluster Sampling
c. Systematic Sampling
d. Stratified Sampling
e. Simple Random Sampling
A small coffee shop sells freshly squeezed juices in a refrigerated unit with slots where juice is displayed. These slots are called facings. The manager of the coffee shop suspects that the distribution of juice sales is different than the distribution of facings for each type of juice, so the manager records the sales of each juice over a two-week period. The proportion of facings and the sales for each type of juice are shown in the tables.
Does the coffee shop owner have sufficient evidence to conclude that the distribution of sales is proportional to the number of facings at a 5 percent level of significance? Conduct the appropriate statistical test to support your conclusion.
To detect the presence of harmful insects in farm fields, we can put up boards covered with a sticky material and examine the insects trapped on the boards.
Which colors attract insects best?
Experimenters placed boards of several colors at random locations in a field of oats (four colors and six boards of each color).
Make a plot of the number of beetles trapped on each board against the board's color, arranging the colors to show blue first, then white, then green, and last yellow (space the four colors equally on the horizontal axis).
Chapter 1 Solutions
Understandable Statistics: Concepts and Methods
Ch. 1.1 - Statistical Literacy In a statistical study what...Ch. 1.1 - Statistical Literacy Are data at the nominal level...Ch. 1.1 - Statistical Literacy What is the difference...Ch. 1.1 - Statistical Literacy For a set population, does a...Ch. 1.1 - Critical Thinking Numbers are often assigned to...Ch. 1.1 - Interpretation Lucy conducted a survey asking some...Ch. 1.1 - Marketing: Fast Food A national survey asked 1261...Ch. 1.1 - Advertising: Auto Mileage What is the average...Ch. 1.1 - Ecology: Wetlands Government agencies carefully...Ch. 1.1 - Archaeology: Ireland The archaeological site of...
Ch. 1.1 - Student Life: Levels of Measurement Categorize...Ch. 1.1 - Business: Levels of Measurement Categorize these...Ch. 1.1 - Fishing: Levels of Measurement Categorize these...Ch. 1.1 - Education: Teacher Evaluation If you were going to...Ch. 1.1 - Critical Thinking You are interested in the...Ch. 1.2 - Statistical Literacy Explain the difference...Ch. 1.2 - Statistical Literacy Explain the difference...Ch. 1.2 - Statistical Literacy Marcie conducted a study of...Ch. 1.2 - Statistical Literacy A random sample of students...Ch. 1.2 - Interpretation In a random sample of 50 students...Ch. 1.2 - Interpretation A campus performance series...Ch. 1.2 - Critical Thinking Greg took a random sample of...Ch. 1.2 - Critical Thinking Consider the students in your...Ch. 1.2 - Critical Thinking Suppose you are assigned the...Ch. 1.2 - Critical Thinking In each of the following...Ch. 1.2 - Sampling: Random Use a random-number table to...Ch. 1.2 - Prob. 12PCh. 1.2 - Sampling: Random Use a random-number table to...Ch. 1.2 - Prob. 14PCh. 1.2 - Computer Simulation: Roll of a Die A die is a cube...Ch. 1.2 - Education: Test Construction Professor Gill is...Ch. 1.2 - Education: Test Construction Professor Gill uses...Ch. 1.2 - Sampling Methods: Benefits Package An important...Ch. 1.2 - Sampling Methods: Health Care Modern Managed...Ch. 1.3 - Statistical Literacy A study of college graduates...Ch. 1.3 - Statistical Literacy Consider a completely...Ch. 1.3 - Critical Thinking A brief survey regarding...Ch. 1.3 - Critical Thinking A randomized block design was...Ch. 1.3 - Interpretation Zane is examining two studies...Ch. 1.3 - Interpretation Suppose you are looking at the 2006...Ch. 1.3 - Ecology: Gathering Data Which technique for...Ch. 1.3 - General: Gathering Data Which technique for...Ch. 1.3 - General: Completely Randomized Experiment How...Ch. 1.3 - Surveys: Manipulation The New York Times did a...Ch. 1.3 - Critical Thinking An agricultural study is...Ch. 1 - Critical Thinking Sudoku is a puzzle consisting of...Ch. 1 - Prob. 2CRPCh. 1 - Statistical Literacy You are conducting a study of...Ch. 1 - Prob. 4CRPCh. 1 - Prob. 5CRPCh. 1 - General: Type of Sampling Categorize the type of...Ch. 1 - Prob. 7CRPCh. 1 - General: Experiment How would you use a completely...Ch. 1 - Prob. 11CRPCh. 1 - Prob. 2DHCh. 1 - Prob. 1LCCh. 1 - Discuss each of the following topics in class or...Ch. 1 - Prob. 1UTCh. 1 - Prob. 2UT
Knowledge Booster


Learn more about
Need a deep-dive on the concept behind this application? Look no further. Learn more about this topic, statistics and related others by exploring similar questions and additional content below.Similar questions
- A number generator was used to simulate the percentage of people in a town who ride a bike. The process simulates randomly selecting 100 people from the town and was repeated 20 times. The percentage of people who ride a bike is shown in the dot plot. 10 20 30 40 50 60 70 80 90 100 Which statement is true about the population of the town? O Most likely, 50% to 60% of the town rides a bike. O Most likely, 60% to 75% of the town rides a bike. O Most likely, 40% to 50% of the town rides a bike. O Most likely, 80% to 90% of the town rides a bike.arrow_forwardSuppose automobile insurance companies gave annual premiums for top-rated companies in several states. The figure below shows box plots for the annual premium for urban customers in three states. Insurance Premium (annual, urban) HCalifomie Pennaylvania Texasarrow_forwardCheck whether the representation of pets in the population is different from: dog 41%, cat 33%, fish 10%, other 16%. α = 0.05. I am sending a screenshot with only one PART of the data in the attachmentarrow_forward
- The quantity of dissolved oxygen is a measure of water pollution in lakes, rivers, and streams. Water samples were taken at four different locations in a river in an effort to determine if water pollution varied from location to location. Location I was 500 meters above an industrial plant water discharge point and near the shore. Location II was 200 meters above the discharge point and in midstream. Location III was 50 meters downstream from the discharge point and near the shore. Location IV was 200 meters downstream from the discharge point and in midstream. The following table shows the results. Lower dissolved oxygen readings mean more pollution. Because of the difficulty in getting midstream samples, ecology students collecting the data had fewer of these samples. Use a 5% level of significance. Do we reject or not reject the claim that the quantity of dissolved oxygen does not vary from one location to another? Location I Location II Location III Location IV 7.6 6.3 4.6…arrow_forwardThe quantity of dissolved oxygen is a measure of water pollution in lakes, rivers, and streams. Water samples were taken at four different locations in a river in an effort to determine if water pollution varied from location to location. Location I was 500 meters above an industrial plant water discharge point and near the shore. Location II was 200 meters above the discharge point and in midstream. Location III was 50 meters downstream from the discharge point and near the shore. Location IV was 200 meters downstream from the discharge point and in midstream. The following table shows the results. Lower dissolved oxygen readings mean more pollution. Because of the difficulty in getting midstream samples, ecology students collecting the data had fewer of these samples. Use a 1%level of significance. Do we reject or not reject the claim that the quantity of dissolved oxygen does not vary from one location to another? Location I Location II Location III Location IV 7.6 6.7 4.8 4.9…arrow_forwardThe quantity of dissolved oxygen is a measure of water pollution in lakes, rivers, and streams. Water samples were taken at four different locations in a river in an effort to determine if water pollution varied from location to location. Location I was 500 meters above an industrial plant water discharge point and near the shore. Location II was 200 meters above the discharge point and in midstream. Location III was 50 meters downstream from the discharge point and near the shore. Location IV was 200 meters downstream from the discharge point and in midstream. The following table shows the results. Lower dissolved oxygen readings mean more pollution. Because of the difficulty in getting midstream samples, ecology students collecting the data had fewer of these samples. Use a 5% level of significance. Do we reject or not reject the claim that the quantity of dissolved oxygen does not vary from one location to another? Location I Location II Location III Location IV 7.1 6.6 4.6…arrow_forward
- The quantity of dissolved oxygen is a measure of water pollution in lakes, rivers, and streams. Water samples were taken at four different locations in a river in an effort to determine if water pollution varied from location to location. Location I was 500 meters above an industrial plant water discharge point and near the shore. Location II was 200 meters above the discharge point and in midstream. Location III was 50 meters downstream from the discharge point and near the shore. Location IV was 200 meters downstream from the discharge point and in midstream. The following table shows the results. Lower dissolved oxygen readings mean more pollution. Because of the difficulty in getting midstream samples, ecology students collecting the data had fewer of these samples. Use a 5% level of significance. Do we reject or not reject the claim that the quantity of dissolved oxygen does not vary from one location to another? Location I Location II Location III Location IV 7.4 6.3 4.5…arrow_forwardThe histogram below gives the length of service of members of the Department of Chemistry at a particular university. The classes, in years of service, are 0−−4.9, 5−−9.9, etc., and the vertical axis represents the number of faculty. (a) What percent of the department faculty have 25 or more years of service? (b) If a member of the department is chosen at random to serve on a university committee, what is the probability (in decimal form) that the chosen representitive will have between 5 and 35 years of service? (c) What is the probability the representative above will have less than 30 years of service given that the person has less than 35 years of service?arrow_forwardThe quantity of dissolved oxygen is a measure of water pollution in lakes, rivers, and streams. Water samples were taken at four different locations in a river in an effort to determine if water pollution varied from location to location. Location I was 500 meters above an industrial plant water discharge point and near the shore. Location II was 200 meters above the discharge point and in midstream. Location III was 50 meters downstream from the discharge point and near the shore. Location IV was 200 meters downstream from the discharge point and in midstream. The following table shows the results. Lower dissolved oxygen readings mean more pollution. Because of the difficulty in getting midstream samples, ecology students collecting the data had fewer of these samples. Use a 10% level of significance. Do we reject or not reject the claim that the quantity of dissolved oxygen does not vary from one location to another? Location I Location II Location III Location IV 7.1 6.6 4.3 4.7 6.7…arrow_forward
- U.S. Divisions and Regions. The U.S. Census Bureau classifies the states in the United States by region and division. The data giving the region and division of each state are presented on the WeissStats site. Use the technology of your choice to determine the mode(s) of the a. regions. b. divisions.arrow_forwardWhat percentage of the blocks are red?arrow_forwardA case-control study was conducted to examine the association between lung cancer and smoking in men. The case group contains 500 patients, who were diagnosed with lung cancer. Five hundred age-matched patients were recruited as controls. The study found that 50% of cases were regular smoking and the proportion is 20% among controls. a. Create a 2x2 table based on the given informationarrow_forward
arrow_back_ios
SEE MORE QUESTIONS
arrow_forward_ios
Recommended textbooks for you
 Glencoe Algebra 1, Student Edition, 9780079039897...AlgebraISBN:9780079039897Author:CarterPublisher:McGraw Hill
 Holt Mcdougal Larson Pre-algebra: Student Edition...AlgebraISBN:9780547587776Author:HOLT MCDOUGALPublisher:HOLT MCDOUGAL
 Big Ideas Math A Bridge To Success Algebra 1: Stu...AlgebraISBN:9781680331141Author:HOUGHTON MIFFLIN HARCOURTPublisher:Houghton Mifflin Harcourt
Glencoe Algebra 1, Student Edition, 9780079039897...
Algebra
ISBN:9780079039897
Author:Carter
Publisher:McGraw Hill
Holt Mcdougal Larson Pre-algebra: Student Edition...
Algebra
ISBN:9780547587776
Author:HOLT MCDOUGAL
Publisher:HOLT MCDOUGAL
Big Ideas Math A Bridge To Success Algebra 1: Stu...
Algebra
ISBN:9781680331141
Author:HOUGHTON MIFFLIN HARCOURT
Publisher:Houghton Mifflin Harcourt
Statistics 4.1 Point Estimators; Author: Dr. Jack L. Jackson II;https://www.youtube.com/watch?v=2MrI0J8XCEE;License: Standard YouTube License, CC-BY
Statistics 101: Point Estimators; Author: Brandon Foltz;https://www.youtube.com/watch?v=4v41z3HwLaM;License: Standard YouTube License, CC-BY
Central limit theorem; Author: 365 Data Science;https://www.youtube.com/watch?v=b5xQmk9veZ4;License: Standard YouTube License, CC-BY
Point Estimate Definition & Example; Author: Prof. Essa;https://www.youtube.com/watch?v=OTVwtvQmSn0;License: Standard Youtube License
Point Estimation; Author: Vamsidhar Ambatipudi;https://www.youtube.com/watch?v=flqhlM2bZWc;License: Standard Youtube License