
Concept explainers
Videos
Cigarette smoking. The data in Table 7 shows that the percentage of female cigarette smokers in the United States declined from
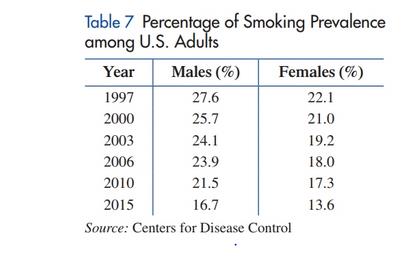
Applying linear regression to the data for females in Table 7 produces the model
where
since 1997. Draw a
model on the same axes.
(B) Estimate the first year in which the percentage of female smokers is less than
Want to see the full answer?
Check out a sample textbook solution
Chapter 1 Solutions
Finite Mathematics for Business, Economics, Life Sciences and Social Sciences
Additional Math Textbook Solutions
A Problem Solving Approach to Mathematics for Elementary School Teachers (12th Edition)
Calculus Volume 1
Probability and Statistics for Engineers and Scientists
Calculus Volume 2
Thinking Mathematically (7th Edition)
A Problem Solving Approach To Mathematics For Elementary School Teachers (13th Edition)


- Does Table 1 represent a linear function? If so, finda linear equation that models the data.arrow_forwardFind the equation of the regression line for the following data set. x 1 2 3 y 0 3 4arrow_forwardWhat is regression analysis? Describe the process of performing regression analysis on a graphing utility.arrow_forward

 Calculus For The Life SciencesCalculusISBN:9780321964038Author:GREENWELL, Raymond N., RITCHEY, Nathan P., Lial, Margaret L.Publisher:Pearson Addison Wesley,
 Glencoe Algebra 1, Student Edition, 9780079039897...AlgebraISBN:9780079039897Author:CarterPublisher:McGraw Hill
 Functions and Change: A Modeling Approach to Coll...AlgebraISBN:9781337111348Author:Bruce Crauder, Benny Evans, Alan NoellPublisher:Cengage Learning
 Trigonometry (MindTap Course List)TrigonometryISBN:9781305652224Author:Charles P. McKeague, Mark D. TurnerPublisher:Cengage Learning