
Videos
a)
To construct a
a)
Explanation of Solution
Given:
The data is,
| Student | Posttest | Final Exam |
| 1 | 100 | 98 |
| 2 | 96 | 97 |
| 3 | 88 | 88 |
| 4 | 100 | 100 |
| 5 | 100 | 100 |
| 6 | 96 | 78 |
| 7 | 80 | 68 |
| 8 | 68 | 47 |
| 9 | 92 | 90 |
| 10 | 96 | 94 |
| 11 | 88 | 84 |
| 12 | 92 | 93 |
| 13 | 68 | 57 |
| 14 | 84 | 84 |
| 15 | 84 | 81 |
| 16 | 88 | 83 |
| 17 | 72 | 84 |
| 18 | 88 | 93 |
| 19 | 72 | 57 |
| 20 | 88 | 83 |
Calculation:
Following is the scatter plot:
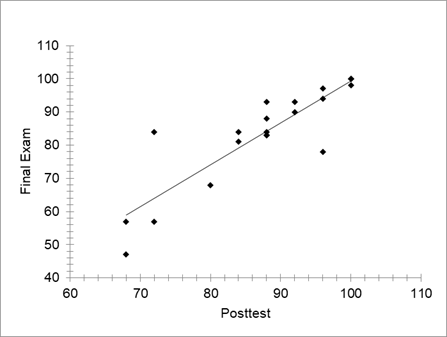
The assumption of linearity holds in the scatter plot.
b)
To find regression equation.
b)
Answer to Problem 12.28E
Explanation of Solution
Given:
The data is,
| Student | Posttest | Final Exam |
| 1 | 100 | 98 |
| 2 | 96 | 97 |
| 3 | 88 | 88 |
| 4 | 100 | 100 |
| 5 | 100 | 100 |
| 6 | 96 | 78 |
| 7 | 80 | 68 |
| 8 | 68 | 47 |
| 9 | 92 | 90 |
| 10 | 96 | 94 |
| 11 | 88 | 84 |
| 12 | 92 | 93 |
| 13 | 68 | 57 |
| 14 | 84 | 84 |
| 15 | 84 | 81 |
| 16 | 88 | 83 |
| 17 | 72 | 84 |
| 18 | 88 | 93 |
| 19 | 72 | 57 |
| 20 | 88 | 83 |
Calculation:
Using excel,
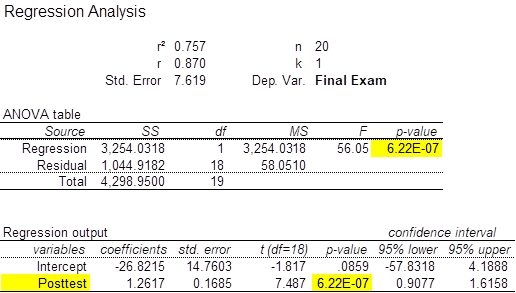
The regression equation is,
c)
To explain if data present sufficient evidence to indicate that final exam score is linearly related to the posttest score.
c)
Answer to Problem 12.28E
Data present sufficient evidence to indicate that final exam score is linearly related to the posttest score.
Explanation of Solution
Given:
The data is,
| Student | Posttest | Final Exam |
| 1 | 100 | 98 |
| 2 | 96 | 97 |
| 3 | 88 | 88 |
| 4 | 100 | 100 |
| 5 | 100 | 100 |
| 6 | 96 | 78 |
| 7 | 80 | 68 |
| 8 | 68 | 47 |
| 9 | 92 | 90 |
| 10 | 96 | 94 |
| 11 | 88 | 84 |
| 12 | 92 | 93 |
| 13 | 68 | 57 |
| 14 | 84 | 84 |
| 15 | 84 | 81 |
| 16 | 88 | 83 |
| 17 | 72 | 84 |
| 18 | 88 | 93 |
| 19 | 72 | 57 |
| 20 | 88 | 83 |
Calculation:
Using excel,

The p-value = 6.22E-07 < 0.05 hence rejecting null hypothesis. Hence, data present sufficient evidence to indicate that final exam score is linearly related to the posttest score.
d)
To find the 99% confidence interval for slope of the regression equation.
d)
Answer to Problem 12.28E
the 99% confidence interval for slope of the regression equation= (0.7767,1.7468)
Explanation of Solution
Given:
The data is,
| Student | Posttest | Final Exam |
| 1 | 100 | 98 |
| 2 | 96 | 97 |
| 3 | 88 | 88 |
| 4 | 100 | 100 |
| 5 | 100 | 100 |
| 6 | 96 | 78 |
| 7 | 80 | 68 |
| 8 | 68 | 47 |
| 9 | 92 | 90 |
| 10 | 96 | 94 |
| 11 | 88 | 84 |
| 12 | 92 | 93 |
| 13 | 68 | 57 |
| 14 | 84 | 84 |
| 15 | 84 | 81 |
| 16 | 88 | 83 |
| 17 | 72 | 84 |
| 18 | 88 | 93 |
| 19 | 72 | 57 |
| 20 | 88 | 83 |
Calculation:
Using excel,
| Regression output | confidence interval | |||||
| variables | coefficients | std. error | t (df=18) | p-value | 99% lower | 99% upper |
| Intercept | -26.8215 | 14.7603 | -1.817 | .0859 | -69.3083 | 15.6652 |
| Posttest | 1.2617 | 0.1685 | 7.487 | 6.22E-07 | 0.7767 | 1.7468 |
Confidence interval = (0.7767,1.7468)
Want to see more full solutions like this?
Chapter 12 Solutions
EP INTRODUCTION TO PROBABILITY+STAT.


 Glencoe Algebra 1, Student Edition, 9780079039897...AlgebraISBN:9780079039897Author:CarterPublisher:McGraw Hill
 College Algebra (MindTap Course List)AlgebraISBN:9781305652231Author:R. David Gustafson, Jeff HughesPublisher:Cengage Learning
 Big Ideas Math A Bridge To Success Algebra 1: Stu...AlgebraISBN:9781680331141Author:HOUGHTON MIFFLIN HARCOURTPublisher:Houghton Mifflin Harcourt
 Holt Mcdougal Larson Pre-algebra: Student Edition...AlgebraISBN:9780547587776Author:HOLT MCDOUGALPublisher:HOLT MCDOUGAL