
Concept explainers
Videos
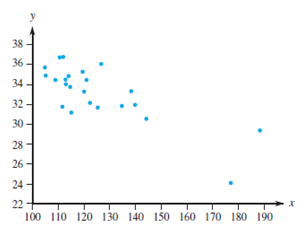
One factor in the development of tennis elbow, a malady that strikes fear in the hearts of all serious tennis players, is the impact-induced vibration of the racket-and-arm system at ball contact. It is well known that the likelihood of getting tennis elbow depends on various properties of the racket used. Consider the scatterplot of x = racket resonance frequency (Hz) and y = sum of peak-to-peak acceleration (a characteristic of arm vibration, in m/sec/sec) for n = 23 different rackets (“Transfer of Tennis Racket Vibrations into the Human Forearm.” Medicine and Science in Sports and Exercise, 1992: 1134–1140). Discuss interesting features of the data and scatterplot.

Trending nowThis is a popular solution!

Chapter 12 Solutions
WEBASSIGN ACCESS FOR PROBABILITY & STATS


- Repeat Example 5 when microphone A receives the sound 4 seconds before microphone B.arrow_forwardAn environmental chemist is performing a study of iron in atmospheric particulate measured downwind from a steel mill. She is concerned that wind velocity at the time of measurement may affect the readings. So, she decided to obtain observations on 30 randomly chosen days during the period of peak operation of the mill. She then, compares measurements taken on days when the wind is calm (velocity ≤ 5 knots) with measurements taken on windy days (velocity > 5 knots). The data are presented as the following: Table 1: Measurement of iron Calms Days Windy Days 0.68 0.74 0.88 0.25 0.29 0.3 0.43 0.45 0.5 0.89 0.97 1 0.65 0.91 0.92 0.93 0.95 1.01 1.17 1.25 1.27 0.69 0.74 0.8 0.87 0.87 0.89 8.85 1.54 0.6 1.03 1.16 By using SPSS or Minitab only: (1) Generate a descriptive table and summarize the data. (ii) Synthesize and discuss the different on the iron level between two days using boxplots. (iii) Propose the appropriate test to the study.arrow_forwardStarfish coildots is a disease affecting approximately 40 different species of sea stars and several other echinoderms. A sample of 240 ochre starfish and 155 sunflower starfish found that 97 ochre starfish and 54 sunflower starfish showed signs of infection. Is there evidence to suggest that the difference in the proportion of infected ochre starfish is greater than the proportion of infected sunflower starfish? (a) Define the parameter(s) of interest using the correct notation. Then, state the null and alternative hypotheses for this study. (b) Calculate the observed test statistic and state the distribution it follows (including degrees of freedom, if needed). (c) Give the p-value, or a range of appropriate values for the p-value. (d) Using the significance level α = 0.10, state your conclusions regarding the proportion of infected starfish in a plain English sentence. (e) Determine the 90% confidence interval for the difference in the proportions of infected ochre starfish and…arrow_forward
- Cell Phone Radiation Listed below are the measured radiation absorption rates (in W/kg) corresponding to these cell phones: iPhone 5S, BlackBerry Z30, Sanyo Vero, Optimus V, Droid Razr, Nokia N97, Samsung Vibrant, Sony Z750a, Kyocera Kona, LG G2, and Virgin Mobile Supreme. The data are from the Federal Communications Commission. If one of each model of cell phone is measured for radiation and the results are used to find the measures of variation, are the results typical of the population of cell phones that are in use?arrow_forwardAn experiment is conducted to see the effect of light intensity on plant growth, what is the dependent variable in this scenario?arrow_forwardLeo used an analog sensor to measure the temperature of his solar panels. After the experiment, he wants to process the data he obtained. Is he allowed to describe the data by using the measures of central tendency? No, because the data he gathered is qualitative in nature. Yes, because the data he gathered is quantitative in nature. No, because the data the gathered is quantitative in nature. Yes, because the data he gathered is qualitative in nature.arrow_forward
- Maintaining your balance may get harder as you grow older. A study was conducted to see how steady the elderly is on their feet. They had the subjects stand on a force platform and have them react to a noise. The force platform then measured how much they swayed forward and backward, and the data is in table #7.3.10 ("Maintaining balance while," 2013). Do the data show that the elderly sway more than the mean forward sway of younger people, which is 18.125 mm? Test at the 5% level. Table #7.3.10: Forward/backward Sway (in mm) of Elderly Subjects 19 30 20 19 29 25 21 24 50arrow_forwardOphthalmology Retinitis pigmentosa (RP) is a hereditary ocular disease in which patches of pigment appear on the retina, potentially resulting in substantial vision loss and in some cases complete blindness. An important issue is how fast the subjects decline. Visual field is an important measure of area of vision, which is measured in degree2. A visual field area for a normal person is around 11,000 degree2. The longitudinal data in Table 11.29 were provided by an individual patient. tablE 11.29 Longitudinal visual field data for one RP patient Time Visual field area ln Visit (yr) (degree2) (visual field area) 1 0 3059 8.03 2 1 3053 8.02 3 2 1418 7.26 4 3 1692 7.43 5 4 1978 7.59 6 5 1567 7.36 7 6 1919 7.56 8 7 1998 7.60 9 11 1648 7.41 10 13 1721 7.45 11 15 1264 7.14 mean 6.09 1938 7.532 sd 4.97 597 0.280 Suppose the rate of change of ln (visual field) is a linear function of follow-up time. 11.103 Write down a linear regression model that summarizes…arrow_forwardA paper gives data on x = change in Body Mass Index (BMI, in kilograms/meter) and y = change in a measure of depression for patients suffering from depression who participated in a pulmonary rehabilitation program. The table below contains a subset of the data given in the paper and are approximate values read from a scatterplot in the paper. BMI Change (kg/m²) -0.5 0.7 0.5 0.1 0.8 1 1.5 1.2 1 0.4 0.4 Depression Score Change -1 4 4 8 13 14 16 18 12 14 The accompanying computer output is from Minitab. Fitted Line Plot Depression score change = 6.598 + 5.327 BMI change 20- 5.10254 R-Sq R-Sq (adj) 20.06% 27.32% 15- 10- 5- 0- -0.5 0.0 0.5 1.0 1.5 BMI change R-sq 5.10254 27.32% Coefficients Term Coef SE Coef T-Value P-Value VIF Constant 6.598 2.19 3.01 0.0132 BMI change 5.327 2.75 1.94 0.0812 1.00 Regression Equation Depression score change = 6.598 + 5.327 BMI change (a) What percentage of observed variation in depression score change can be explained by the simple linear regression model?…arrow_forward
- A paper gives data on x = change in Body Mass Index (BMI, in kilograms/meter2) and y = change in a measure of depression for patients suffering from depression who participated in a pulmonary rehabilitation program. The table below contains a subset of the data given in the paper and are approximate values read from a scatterplot in the paper. BMI Change (kg/m²) 0.5 -0.5 0 0.1 0.7 0.8 1 1.5 1.2 1 0.4 0.4 Depression Score Change -1 9 4 4 5 8 13 14 17 18 12 14 The accompanying computer output is from Minitab. Fitted Line Plot Depression score change = 6.512 + 5.472 BMI change 20 S 5.26270 R-Sq 27.16% R-Sq (adj) 19.88% 15- : 10- -0.5 0.0 1.5 Ⓡ S 5.26270 Coefficients Term Coef VIF SE Coef 2.26 T-Value 2.88 P-Value 0.0164 Constant 6.512 BMI change 5.472 2.83 1.93 0.0823 1.00 Regression Equation Depression score change = 6.512 + 5.472 BMI change (a) What percentage of observed variation in depression score change can be explained by the simple linear regression model? (Round your answer to…arrow_forwardAs the world warms, the geographic ranges of species might shift toward cooler areas. Chen et al. (2011) studied recent changes in the highest elevation at which species occur. Typically, higher elevations are cooler than lower elevations. Below are the changes in highest elevation for 20 of the 31 taxa examined in this study, in meters, over the late 1900s and early 2000s. (Taxa included plants, vertebrates, and arthropods.) Positive numbers indicate upward shifts in elevation, and negative numbers indicate shifts to lower elevations. The values are also displayed in the attached graph. What is the standard error of the mean of elevational range shift in these 20 species? (Do not include units, but remember they are meters), and express answer to 3 significant digits) 58.9 7.8 108.6 44.8 19.2 30.5 7.4 39.3 24 62.1 24.3 32.7 65.3 -19.3 -5.2 -2.1 31 88.6 20.7 89 9 8 7 6 5 4 3 2 1 0 Elevation change in m [-19.3, 0.7] (0.7, 20.7] (20.7, 40.7] (40.7, 60.7] (60.7, 80.7] (80.7, 100.7 100.7,…arrow_forwardHoaglin, Mosteller, and Tukey (1983) presented data on blood levels of beta-endorphin as a function of stress. They took beta-endorphin levels for 19 patients 12 hours before surgery and again 10 minutes before surgery. The data are presented below, in fmol/ml Based on these date, what effect does icreased stressed have on endorphin levels. Solve by hand or SPSS. Participant 12 hours before 10 minutes before 1 10 6.5 2 6.5 14.0 3 8.0 13.5 4 12 18 5 5.0 14.5 6 11.5 9.0 7 5.0 18.0 8 3.5…arrow_forward
 Linear Algebra: A Modern IntroductionAlgebraISBN:9781285463247Author:David PoolePublisher:Cengage Learning
 Algebra & Trigonometry with Analytic GeometryAlgebraISBN:9781133382119Author:SwokowskiPublisher:Cengage
 Calculus For The Life SciencesCalculusISBN:9780321964038Author:GREENWELL, Raymond N., RITCHEY, Nathan P., Lial, Margaret L.Publisher:Pearson Addison Wesley,
 Glencoe Algebra 1, Student Edition, 9780079039897...AlgebraISBN:9780079039897Author:CarterPublisher:McGraw Hill
 Trigonometry (MindTap Course List)TrigonometryISBN:9781337278461Author:Ron LarsonPublisher:Cengage Learning