Mathematical Ideas (13th Edition) - Standalone book
13th Edition
ISBN: 9780321977076
Author: Charles D. Miller, Vern E. Heeren, John Hornsby, Christopher Heeren
Publisher: PEARSON
expand_more
expand_more
format_list_bulleted
Videos
Question
Chapter 12.1, Problem 19E
To determine
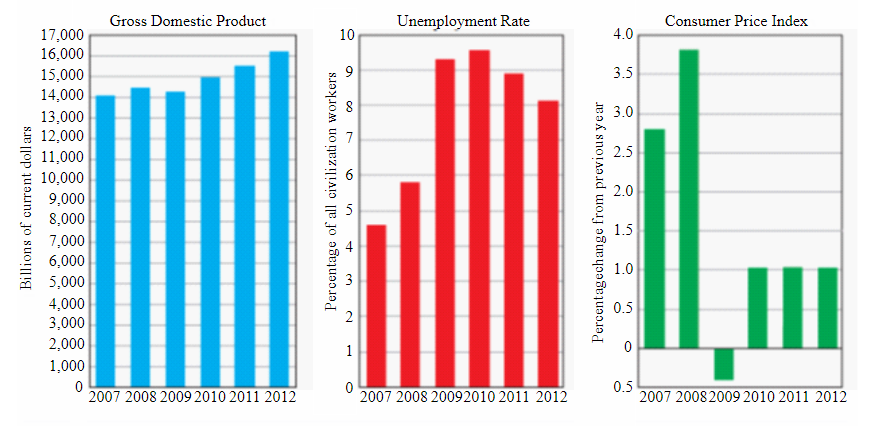
Observe the most unusual occurrence during the six years of trends in economic indicators if the graph below showing trends in economic indicators.
Expert Solution & Answer
Want to see the full answer?
Check out a sample textbook solution
Students have asked these similar questions
A total of 100 members of a hiking club are periodically
evaluated for Lyme disease to comply with their club
charter. The graph shown depicts the onset of Lyme
disease among the members between 1997 and 1999.
Which of the following is the incidence of Lyme disease
within this population in 1998?
Prior to
000
1997
O
a. 2/95
b. 2/100
c. 5/95
d. 5/100
e. 7/95
f. 7/100
1998
O
O
QUESTION 2
Over time, the number of Americans celebrating Halloween has increased. The bar graph below shows how many Americans celebrated
Halloween (measured in millions of people) each year from 2012 through 2018.
Celebration of Halloween by Year
185
ll
180
O 175
170
( 165 +
160
> 155
150
145
2012
2013
2014
2015
2016
2017
2018
Year
Use the bar graph to answer the following questions.
a. How many Americans celebrated Halloween in 2018?
b. In which year did the fewest number of Americans celebrate Halloween?
c. In which year did approximately 162,000,000 Americans celebrate Halloween?
d. Is this bar graph a Pareto Chart?
Millions of Americans
Graph the following.
Chapter 12 Solutions
Mathematical Ideas (13th Edition) - Standalone book
Ch. 12.1 - In Exercises I and 2, use the given data to do the...Ch. 12.1 - In Exercises 1 and 2, use the given data to do the...Ch. 12.1 - In Exercises 3-6, use the given data to do the...Ch. 12.1 - In Exercises 3-6, use the given data to do the...Ch. 12.1 - In Exercises 3-6, use the given data to do the...Ch. 12.1 - In Exercises 3-6, use the given data to do the...Ch. 12.1 - In each of Exercises 7-10, construct a...Ch. 12.1 - In each of Exercises 7-10, construct a...Ch. 12.1 - In each of Exercises 7-10, construct a...Ch. 12.1 - In each of Exercises 7-10, construct a...
Ch. 12.1 - Federal Revenue and Spending The graph shows U.S....Ch. 12.1 - Federal Revenue and Spending The graph shows U.S....Ch. 12.1 - Federal Revenue and Spending The graph shows U.S....Ch. 12.1 - Federal Revenue and Spending The graph shows U.S....Ch. 12.1 - Prob. 15ECh. 12.1 - Refer to the above graphs for Exercises 16-20....Ch. 12.1 - Prob. 17ECh. 12.1 - Refer to the above graphs for Exercises 16-20....Ch. 12.1 - Prob. 19ECh. 12.1 - Refer to the above graphs for Exercises 16-20....Ch. 12.1 - Reading a Circle Graph of Job-Training Sources The...Ch. 12.1 - Reading a Circle Graph of Job-Training Sources The...Ch. 12.1 - Prob. 23ECh. 12.1 - Correspondence between Education and Earnings Data...Ch. 12.1 - Prob. 25ECh. 12.1 - Net Worth of Retirement Savings Saura, wishing to...Ch. 12.1 - Prob. 27ECh. 12.1 - Net Worth of Retirement Savings Saura, wishing to...Ch. 12.1 - Prob. 29ECh. 12.1 - Sample Masses in a Geology Laboratory...Ch. 12.1 - Sample Masses in a Geology Laboratory...Ch. 12.1 - Record Temperatures According to the National...Ch. 12.1 - Prob. 33ECh. 12.1 - Frequencies and Probabilities of letter Occurrence...Ch. 12.1 - Prob. 35ECh. 12.1 - Prob. 36ECh. 12.1 - 37. Is the probability distribution in Exercise 36...Ch. 12.1 - Prob. 38ECh. 12.1 - Probabilities of Study Times Recall that the...Ch. 12.1 - Favorite Sports among Recreation Students The 40...Ch. 12.1 - Favorite Sports among Recreation Students The 40...Ch. 12.1 - Favorite Sports among Recreation Students The 40...Ch. 12.2 - For each list of data, calculate (a) the mean (to...Ch. 12.2 - For each list of data, calculate (a) the mean (to...Ch. 12.2 - For each list of data, calculate (a), the mean (to...Ch. 12.2 - For each list of data, calculate (a) the mean (to...Ch. 12.2 - For each list of data, calculate (a) the mean (to...Ch. 12.2 - For each list of data, calculate (a) the mean (to...Ch. 12.2 - For each list of data, calculate (a) the mean (to...Ch. 12.2 - For each list of data, calculate (a) the mean (to...Ch. 12.2 - Answer each question. Gymnasts' Scores An Olympic...Ch. 12.2 - Quiz Grades The average of 5 quiz grades is 10....Ch. 12.2 - For each category in Exercises 11-16, find (a) (he...Ch. 12.2 - For each category in Exercises 11-16, find (a) the...Ch. 12.2 - For each category in Exercises 11-16, find (a) the...Ch. 12.2 - For each category in Exercises 11-16, find (a) the...Ch. 12.2 - For each category in Exercises 11-16, find (a) the...Ch. 12.2 - For each category in Exercises 11-16, find (a) the...Ch. 12.2 - Leading U.S. Businesses The table shows the top...Ch. 12.2 - Leading U.S. Businesses The table shows the top...Ch. 12.2 - Measuring Elapsed Times While doing an experiment,...Ch. 12.2 - Measuring Elapsed Times White doing an experiment,...Ch. 12.2 - The student from Exercises 19 and 20,when...Ch. 12.2 - The student from Exercises 19 and 20,when...Ch. 12.2 - The student from Exercises 19 and 20,when...Ch. 12.2 - The student from Exercises 19 and 20, when...Ch. 12.2 - Scores on Management Examinations Thao earned the...Ch. 12.2 - Scores on Management Examinations Thao earned the...Ch. 12.2 - Scores on Management Examinations Thao earned the...Ch. 12.2 - For each of the following frequency distributions,...Ch. 12.2 - Prob. 29ECh. 12.2 - 30. Average Employee Salary A company has
15...Ch. 12.2 - Grade-Point Averages Find the grade-point average...Ch. 12.2 - Grade-Point Averages Find the grade-point average...Ch. 12.2 - Prob. 33ECh. 12.2 - Federal Budget Totals The table gives federal...Ch. 12.2 - Prob. 35ECh. 12.2 - World Cell Phone Use In 2012, just the top six...Ch. 12.2 - Prob. 37ECh. 12.2 - Crew, Passengers, and Hijackers on 3/11 Airliners...Ch. 12.2 - Prob. 39ECh. 12.2 - Olympic Medal Standings The top ten medal-winning...Ch. 12.2 - Prob. 41ECh. 12.2 - Olympic Medal Standings The top ten medal-winning...Ch. 12.2 - Prob. 43ECh. 12.2 - In Exercises 44 and 45, use the given...Ch. 12.2 - Prob. 45ECh. 12.2 - What does your box plot of Exercise 18 for...Ch. 12.2 - Prob. 47ECh. 12.2 - Prob. 48ECh. 12.2 - Prob. 49ECh. 12.2 - Prob. 50ECh. 12.2 - Prob. 51ECh. 12.2 - Prob. 52ECh. 12.2 - Prob. 53ECh. 12.2 - Prob. 54ECh. 12.2 - Prob. 55ECh. 12.2 - Prob. 56ECh. 12.2 - Prob. 57ECh. 12.2 - Prob. 58ECh. 12.2 - For Exercises 57-59, refer to the grouped...Ch. 12.2 - Prob. 60ECh. 12.3 - 1. If your calculator finds both the sample...Ch. 12.3 - 2. If your calculator finds only one kind of...Ch. 12.3 - Find (a) the range, and (b) the standard deviation...Ch. 12.3 - Find (a) the range, and (b) the standard deviation...Ch. 12.3 - Find (a) the range, and (b) the standard deviation...Ch. 12.3 - Find (a) the range, and (b) the standard deviation...Ch. 12.3 - Find (a) the range, and (b) the standard deviation...Ch. 12.3 - Find (a) the range, and (b) the standard deviation...Ch. 12.3 - Find (a) the range, and (b) the standard deviation...Ch. 12.3 - Find (a) the range, and (b) the standard deviation...Ch. 12.3 - Use Chebyshev’s theorem for Exercises 11-22. Give...Ch. 12.3 - Use Chebyshev's theorem for Exercises 11-22. Give...Ch. 12.3 - Use Chebyshev's theorem for Exercises 11-22. Give...Ch. 12.3 - Use Chebyshev's theorem for Exercises 11-22. Give...Ch. 12.3 - Prob. 15ECh. 12.3 - Use Chebyshev's theorem for Exercises 11-22. Give...Ch. 12.3 - Prob. 17ECh. 12.3 - Use Chebyshev's theorem for Exercises 11-22. Give...Ch. 12.3 - Use Chebyshev's theorem for Exercises 11-22. Give...Ch. 12.3 - Use Chebyshev's theorem for Exercises 11-22. Give...Ch. 12.3 - Prob. 21ECh. 12.3 - Use Chebyshev's theorem for Exercises 11-22. Give...Ch. 12.3 - Prob. 23ECh. 12.3 - Travel Accommodation CostsGabriel and Lucia took a...Ch. 12.3 - Travel Accommodation Costs Gabriel and Lucia took...Ch. 12.3 - Travel Accommodation Costs Gabriel and Lucia took...Ch. 12.3 - Travel Accommodation Costs Gabriel and Lucia took...Ch. 12.3 - Travel Accommodation Costs Gabriel and Lucia took...Ch. 12.3 - In Exercises 29 and 30, two samples are given. In...Ch. 12.3 - In Exercises 29 and 30, two samples are given. In...Ch. 12.3 - Utilize the following sample for Exercises...Ch. 12.3 - Utilize the following sample for Exercises 31-36....Ch. 12.3 - Prob. 33ECh. 12.3 - Utilize the following sample for Exercises...Ch. 12.3 - Prob. 35ECh. 12.3 - Utilize the following sample for Exercises...Ch. 12.3 - 37. Comparing Water Heater Lifetimes Two brands of...Ch. 12.3 - Lifetimes of Engine Control Modules Chin manages...Ch. 12.3 - Lifetimes of Engine Control Modules Chin manages...Ch. 12.3 - Prob. 40ECh. 12.3 - 41. In Section 12.2 we showed that the mean, as a...Ch. 12.3 - Prob. 42ECh. 12.3 - A Cereal-Marketing Survey A food distribution...Ch. 12.3 - A Cereal-Marketing Survey A food distribution...Ch. 12.3 - A Cereal-Marketing Survey A food distribution...Ch. 12.3 - Prob. 46ECh. 12.3 - Prob. 47ECh. 12.3 - Prob. 48ECh. 12.3 - Prob. 49ECh. 12.3 - Prob. 50ECh. 12.3 - Prob. 51ECh. 12.3 - Prob. 52ECh. 12.4 - Numbers of Restaurant Customers Refer to the...Ch. 12.4 - Numbers of Restaurant Customers Refer to the...Ch. 12.4 - Numbers of Restaurant Customers Refer to the...Ch. 12.4 - Numbers of Restaurant Customers Refer to the...Ch. 12.4 - In Exercises 5-8, make use of z-scores.
5....Ch. 12.4 - In Exercises 5-8, make use of z-scores.
6....Ch. 12.4 - In Exercises 5-8, make use of z-scores.
7....Ch. 12.4 - In Exercises 5-8, make use of z-scores. Relative...Ch. 12.4 - World's Largest Energy Producers and Consumers The...Ch. 12.4 - World's Largest Energy Producers and Consumers The...Ch. 12.4 - World's Largest Energy Producers and Consumers The...Ch. 12.4 - World's Largest Energy Producers and Consumers The...Ch. 12.4 - World's Largest Energy Producers and Consumers The...Ch. 12.4 - World's Largest Energy Producers and ConsumersThe...Ch. 12.4 - World's Largest Energy Producers and Consumers The...Ch. 12.4 - World's Largest Energy Producers and Consumers The...Ch. 12.4 - Determine which was relatively higher: Canada in...Ch. 12.4 - Construct box plots for both production and...Ch. 12.4 - Prob. 19ECh. 12.4 - 20. Comparing your two box plots of Exercise 18,...Ch. 12.4 - The text stated that for any distribution of data,...Ch. 12.4 - 22. Describe the basic difference between a...Ch. 12.4 - Prob. 23ECh. 12.4 - This chapter has introduced three major...Ch. 12.4 - Prob. 25ECh. 12.4 - Prob. 26ECh. 12.4 - Prob. 27ECh. 12.4 - Prob. 28ECh. 12.4 - Prob. 29ECh. 12.4 - Prob. 30ECh. 12.4 - Prob. 31ECh. 12.4 - Prob. 32ECh. 12.4 - In Exercises 32-35, answer yes or no and explain...Ch. 12.4 - In Exercises 32-35, answer yes or no and explain...Ch. 12.4 - In Exercises 32-35, answer yes or no and explain...Ch. 12.4 - Prob. 36ECh. 12.4 - Prob. 37ECh. 12.4 - Prob. 38ECh. 12.4 - Prob. 39ECh. 12.4 - Prob. 40ECh. 12.4 - Prob. 41ECh. 12.4 - Prob. 42ECh. 12.4 - Prob. 43ECh. 12.4 - Prob. 44ECh. 12.4 - Prob. 45ECh. 12.4 - Prob. 46ECh. 12.4 - Prob. 47ECh. 12.4 - Prob. 48ECh. 12.4 - Prob. 49ECh. 12.4 - Prob. 50ECh. 12.4 - Prob. 51ECh. 12.4 - Prob. 52ECh. 12.4 - Prob. 53ECh. 12.4 - Prob. 54ECh. 12.5 - Identify each variable quantity as discrete or...Ch. 12.5 - Identify each variable quantity as discrete or...Ch. 12.5 - Identify each variable quantity as discrete or...Ch. 12.5 - Prob. 4ECh. 12.5 - Identify each variable quantity as discrete or...Ch. 12.5 - Prob. 6ECh. 12.5 - Measuring the Mass of Ore Samples Suppose 100...Ch. 12.5 - Measuring the Mass of Ore Samples Suppose 100...Ch. 12.5 - Measuring the Mass of Ore Samples Suppose 100...Ch. 12.5 - Measuring the Mass of Ore Samples Suppose 100...Ch. 12.5 - Distribution of IQ Scores On standard IQ tests,...Ch. 12.5 - Distribution of IQ Scores On standard IQ tests,...Ch. 12.5 - Distribution of IQ Scores On standard IQ tests,...Ch. 12.5 - Distribution of IQ Scores On standard IQ tests,...Ch. 12.5 - Find the percentage of area under a normal curve...Ch. 12.5 - Find the percentage of area under a normal curve...Ch. 12.5 - Find the percentage of area under a normal curve...Ch. 12.5 - Find the percentage of area under a normal curve...Ch. 12.5 - Find the percentage of the total area under a...Ch. 12.5 - Find the percentage of the total area under a...Ch. 12.5 - Find the percentage of the total area under a...Ch. 12.5 - Find the percentage of the total area under a...Ch. 12.5 - Find a value of z such that each condition is met....Ch. 12.5 - Find a value of z such that each condition is met....Ch. 12.5 - Find a value of z such that each condition
25....Ch. 12.5 - Find a value of z such that each condition is...Ch. 12.5 - Weights of Peaches A fruit-packing company...Ch. 12.5 - Weights of Peaches A fruit-packing company...Ch. 12.5 - Weights of Peaches A fruit-packing company...Ch. 12.5 - Weights of Peaches A fruit-packing company...Ch. 12.5 - Weights of Peaches A fruit-packing company...Ch. 12.5 - Prob. 32ECh. 12.5 - Prob. 33ECh. 12.5 - Prob. 34ECh. 12.5 - IQs of Employees A large company employs workers...Ch. 12.5 - Prob. 36ECh. 12.5 - Net Weight of Cereal Boxes A certain dry cereal is...Ch. 12.5 - Prob. 38ECh. 12.5 - Prob. 39ECh. 12.5 - Net Weight of Cereal Boxes A certain dry cereal is...Ch. 12.5 - Prob. 41ECh. 12.5 - Prob. 42ECh. 12.5 - Prob. 43ECh. 12.5 - Prob. 44ECh. 12.5 - Assume the following distributions are all normal,...Ch. 12.5 - Prob. 46ECh. 12.5 - Prob. 47ECh. 12.5 - Prob. 48ECh. 12.5 - Prob. 49ECh. 12.5 - Prob. 50ECh. 12.5 - Prob. 51ECh. 12.5 - Prob. 52ECh. 12.5 - Prob. 53ECh. 12.5 - Prob. 54ECh. 12.5 - Prob. 55ECh. 12.5 - Prob. 56ECh. 12.5 - Prob. 57ECh. 12.5 - Prob. 58ECh. 12.5 - Prob. 59ECh. 12.5 - Prob. 60ECh. 12.5 - What percentage of the items lie within 1.25...Ch. 12.5 - Prob. 62ECh. 12 - Visits to Social Networking Sites The table shows...Ch. 12 - Cheaters Never Learn The table here shows the...Ch. 12 - Use this information for Exercises 3 and 4. For...Ch. 12 - Prob. 4TCh. 12 - College Endowment AssetsThe table shows the top...Ch. 12 - College Endowment Assets The table shows the top...Ch. 12 - College Endowment Assets The table shows the top...Ch. 12 - Prob. 8TCh. 12 - Pediatrics Patients Khalida worked the 22 weekdays...Ch. 12 - Prob. 10TCh. 12 - In Exercises 11-14, find the indicated measures...Ch. 12 - In Exercises 11-14, find the indicated measures...Ch. 12 - In Exercises 11-14, find the indicated measures...Ch. 12 - Prob. 14TCh. 12 - Exam Scores in a Criminal Justice Class The...Ch. 12 - Prob. 16TCh. 12 - Use the stem-and-leaf display below for Exercises...Ch. 12 - Prob. 18TCh. 12 - Use the stem-and-leaf display below for Exercises...Ch. 12 - Use the stem-and-leaf display below for...Ch. 12 - Use the stem-and-leaf display below for...Ch. 12 - Prob. 22TCh. 12 - Triple Jump ChampionsAll Summer Olympic...Ch. 12 - Prob. 24TCh. 12 - Season Statistics in Major League Baseball The...Ch. 12 - Season Statistics in Major League Baseball The...Ch. 12 - Season Statistics in Major League Baseball The...Ch. 12 - Prob. 28TCh. 12 - Remission Data for Cocaine and Marijuana Addiction...Ch. 12 - Remission Data for Cocaine and Marijuana Addiction...
Knowledge Booster


Learn more about
Need a deep-dive on the concept behind this application? Look no further. Learn more about this topic, subject and related others by exploring similar questions and additional content below.Similar questions
- Is carbon dating? Why does it work? Give an example in which carbon dating would be useful.arrow_forwardsam and ava compared the weights of their puppies each month during the first half of 2015. The graphs generated from this data are shown belowarrow_forwardThe API test score is an important way to measure how successful California schools are performing if we examine the API scores over the course of several years hopefully we will see a positive pattern. Graph the pattern year : 2007 api 773, year 2008 API 778 year 2009 API 784 year 2010 API 775 year 2011 API 787 year 2012 API 773arrow_forward
- The figure below shows timber production in particular months from 2000 to 2005. Which of the following months of the year seems to have the lowest timber production? (a) January (b) April (c) July (d) Octoberarrow_forwardFind the range of the three graphs shown above in part 4 of Questionarrow_forwardWindow Below are two snapshots of data taken from the covid19.nj.gov website on January 8, 2021. What information can you take away from these graphs? Can the graphs be compared? What might be confusing or misleading about the information? What could you do to better present the information?arrow_forward
- The graphs below give the diabetes mortality rate for countries with low per capita income and countries with high per capita income.arrow_forwardSun spot activity goes in an eleven-year cycle. The last cycle started in 2008 and ended in 2018. Here is the activity per year Year 1996 1997 1998 1999 2000 2001 2002 2003 2004 2005 2006 Number Recorded-per month 8.6 21.6 64.2 93.4 119.6 110.9 104.1 63.6 40.4 29.8 15.2 Prompts: Graph this data (years as input). How do you know the data represents a function? Explain. Does this data represent linear data? Explain fully.arrow_forwardPart d with graph drawingarrow_forward
arrow_back_ios
arrow_forward_ios
Recommended textbooks for you

 College Algebra (MindTap Course List)AlgebraISBN:9781305652231Author:R. David Gustafson, Jeff HughesPublisher:Cengage Learning
 Big Ideas Math A Bridge To Success Algebra 1: Stu...AlgebraISBN:9781680331141Author:HOUGHTON MIFFLIN HARCOURTPublisher:Houghton Mifflin Harcourt
 Glencoe Algebra 1, Student Edition, 9780079039897...AlgebraISBN:9780079039897Author:CarterPublisher:McGraw Hill
 Calculus For The Life SciencesCalculusISBN:9780321964038Author:GREENWELL, Raymond N., RITCHEY, Nathan P., Lial, Margaret L.Publisher:Pearson Addison Wesley,
College Algebra (MindTap Course List)
Algebra
ISBN:9781305652231
Author:R. David Gustafson, Jeff Hughes
Publisher:Cengage Learning
Big Ideas Math A Bridge To Success Algebra 1: Stu...
Algebra
ISBN:9781680331141
Author:HOUGHTON MIFFLIN HARCOURT
Publisher:Houghton Mifflin Harcourt
Glencoe Algebra 1, Student Edition, 9780079039897...
Algebra
ISBN:9780079039897
Author:Carter
Publisher:McGraw Hill
Calculus For The Life Sciences
Calculus
ISBN:9780321964038
Author:GREENWELL, Raymond N., RITCHEY, Nathan P., Lial, Margaret L.
Publisher:Pearson Addison Wesley,
Graph Theory: Euler Paths and Euler Circuits; Author: Mathispower4u;https://www.youtube.com/watch?v=5M-m62qTR-s;License: Standard YouTube License, CC-BY
WALK,TRIAL,CIRCUIT,PATH,CYCLE IN GRAPH THEORY; Author: DIVVELA SRINIVASA RAO;https://www.youtube.com/watch?v=iYVltZtnAik;License: Standard YouTube License, CC-BY