
Videos
(a)
To graph: The plot
(a)
Explanation of Solution
Given: The value of
Graph: The plot is drawn by following these steps:
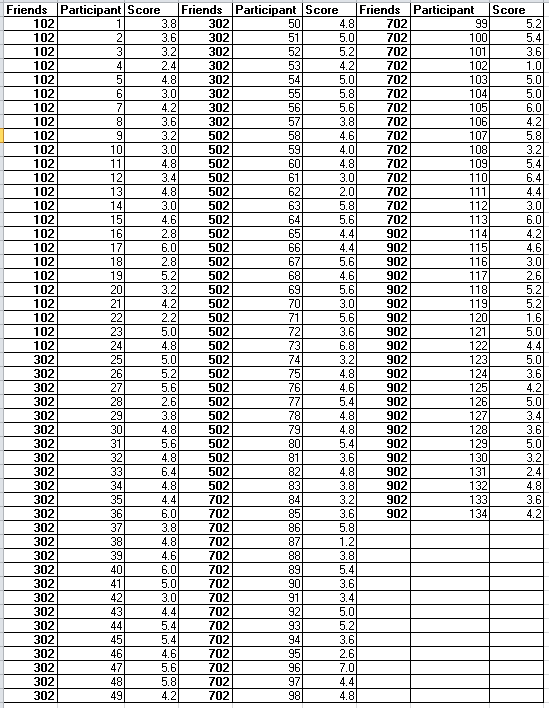
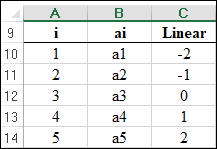
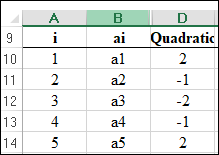
Step 1: Open Excel sheet and write the data value for
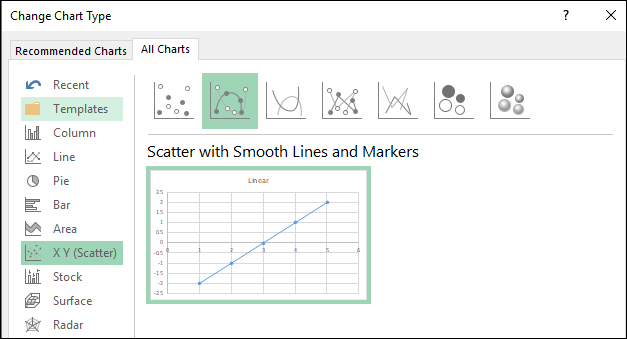
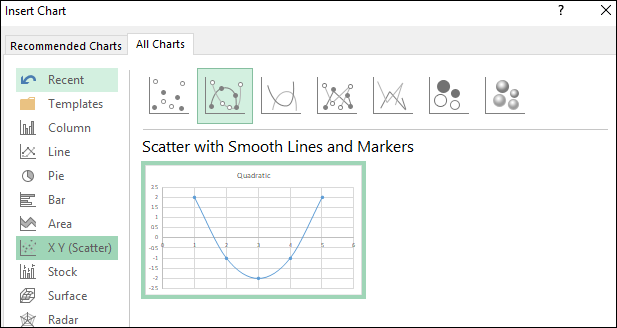
Step 2: INSERT > Recommended Charts > All Charts > Line Chart. The screenshot is shown below:
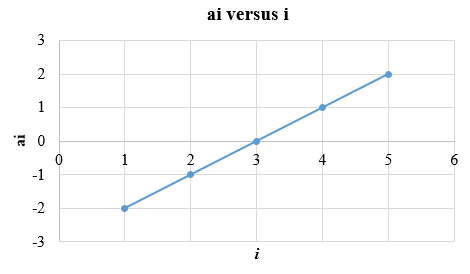
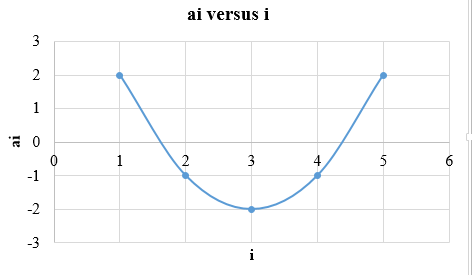
The plot is obtained as shown below:
The values chosen for
The contrast can be calculated by the sum of weighted means. If
Interpretation: The value of
(b)
To graph: The plot
(b)
Explanation of Solution
Graph: The plot is drawn by following these steps:
Step 1: Open Excel sheet and write the data value for
Step 2: INSERT > Recommended Charts > All Charts > Line Chart. The screenshot is shown below:
The plot is obtained as shown below:
The contrast can be calculated by the sum of weighted means. If
The contrast for means
Interpretation: The value chosen,
(c)
To find: The sample contrast quadratic and cubic trend.
(c)
Answer to Problem 50E
Solution: Contrasts for the quadratic trend can be calculated as:
Contrasts for the cubic trend can be calculated as:
Explanation of Solution
Calculation: To find sample contrasts for quadratic and cubic trend by using the Facebook data as follows:
Contrasts for the quadratic trend can be calculated as:
Contrasts for the cubic trend can be calculated as:
(d)
To test: The hypotheses for the linear, quadratic, and cubic trend.
(d)
Answer to Problem 50E
Solution: The P-values are less than 0
Explanation of Solution
Calculation: To test the null hypothesis, steps are as follows:
Contrasts for the linear trend can be calculated as:
Contrasts for the quadratic trend can be calculated as:
Contrasts for the cubic trend can be calculated as:
The pooled standard deviation is obtained as:
The standard error of linear contrast can be calculated as:
The standard error of quadratic contrast can be calculated as:
The standard error of cubic contrast can be calculated as:
The resultant t statistic values for the linear trend can be calculated as:
The resultant t-statistic values for the quadratic trend can be calculated as:
The resultant t-statistic values for the cubic trend can be calculated as:
The resultant P-values are obtained by using the standard normal distribution table as follows:
Conclusion: The P-values is less than 0
Want to see more full solutions like this?
Chapter 12 Solutions
EBK INTRODUCTION TO THE PRACTICE OF STA


- The average salary of Major League Baseball players on opening day from 2000 to 2010 is stored in the following table. Year Salary ($millions) (Please let the coded year start from 0) 2000 2001 2002 2003 2004 2005 2006 2007 2008 2009 2010 A. Fit a linear trend forecasting model. What is the coefficient of the coded year? B. Fit a quadratic trend forecasting model. What is the coefficient of the quadratic term? C. Which model is the most appropriate? A D. Using the most appropriate model, forecast the average salary for 2011. 1.99 2.29 2.38 2.58 2,49 2.63 2.83 2.92 3.13 3.26 3.27 (Round to 3 decimal places) (Round to 5 decimal places) (put "A" for linear model, "B" for quadratic model) (round to 3 decimal places)arrow_forwardWhat does this mean if the simple slope analysis looked like this?arrow_forwardd) Explain the meaning of the coefficient of gender (how does gender affect salary?). Does this variable have a significant impact on income level at a= .05? How do you get this conclusion? For the toolbar, press ALT+F10 (PC) or ALT+FN+F10 (Mac). BIUS Paragraph 10pt A *回GQ Arial +, Ω 田 田 田arrow_forward
- What is the minimum degree polynomial we require to interpolate 4 distinct data points? a. Degree 6 b. Degree 5 c. Degree 4 d. Degree 3 Please give an explanation on your answer, thx!arrow_forwardWhich Model? The following data represent the square footage and rents (dollars per month) for apartments in the La Jolla area of San Diego, California(a) Using a graphing utility, draw a scatter diagram of the data treating square footage as the independent variable. What type of relation appears to exist between square footage and rent? (b) Based on your response to part (a), find either a linear or a quadratic model that describes the relation between square footage and rent. (c) Use your model to predict the rent for an apartment in San Diego that is 875 square feetarrow_forwardA psychologist wants to determine whether there is a relationship between how long it takes a subject to complete a manual task and the number of hours of sleep the subject had the night before. The results from the study of 10 people are given in the following table. Find the equation of the least-squares line for these data.arrow_forward
- Data in the table comes from the NASA Global Climate Change website. It gives the average globaltemperature, in Celsius, for the given year. Use both rows for your calculations. For this problem, youwill see how well year correlates with the average temperature. Let ? be the number of years since1984 and ? be the average global temperature in degrees Celsius.Year 1984 1986 1988 1990 1992 1994 1996 1998 2000Temp 0.16 0.18 0.38 0.45 0.22 0.31 0.33 0.61 0.40Year 2002 2004 2006 2008 2010 2012 2014 2016 2018Temp 0.63 0.54 0.64 0.54 0.72 0.64 0.75 1.02 0.85a. Make a scatterplot of the data. Being sure to clearly label each axis. Keep in mind howeach variable is defined. Based on this scatterplot, is a linear model reasonable for this data set?Briefly explain.b. Determine the correlation coefficient for this data. Interpret this value in context.c. Determine the coefficient of determination for this data. Interpret this value incontext.d.State the regression line for the data.e. What does the…arrow_forwardQ6.3 The World Bank collected data on the percentage of GDP that a country spends on health expenditures ("Health expenditure," 2013) and also the percentage of women receiving prenatal care ("Pregnant woman receiving," 2013). The data for 14 countries where this information is available for the year 2011 are in following table (note: outlier data has been removed): Data of Health Expenditure versus Prenatal Care Health Expenditure (% of GDP) Prenatal Care (%) 3.7 54.6 5.2 93.7 5.2 84.7 10.0 100.0 4.7 42.5 4.8 96.4 6.0 77.1 5.4 58.3 4.8 95.4 4.1 78.0 6.0 93.3 9.5 93.3 6.8 93.7 6.1 89.8 Test at the 5% level for a correlation between percentage spent on health expenditure and the percentage of women receiving prenatal care. (v) Using tables, calculator, or spreadsheet: Determine and enter p-value corresponding to test statistic. Enter value in decimal form rounded to nearest thousandth.…arrow_forwardQ6.2 The World Bank collected data on the percentage of GDP that a country spends on health expenditures ("Health expenditure," 2013) and also the percentage of women receiving prenatal care ("Pregnant woman receiving," 2013). The data for 14 countries where this information is available for the year 2011 are in following table (note: outlier data has been removed): Data of Health Expenditure versus Prenatal Care Health Expenditure (% of GDP) Prenatal Care (%) 3.7 54.6 5.2 93.7 5.2 84.7 10.0 100.0 4.7 42.5 4.8 96.4 6.0 77.1 5.4 58.3 4.8 95.4 4.1 78.0 6.0 93.3 9.5 93.3 6.8 93.7 6.1 89.8 Test at the 5% level for a correlation between percentage spent on health expenditure and the percentage of women receiving prenatal care. (iv) Calculate and enter test statistic Enter value in decimal form rounded to nearest hundredth, with appropriate sign (no spaces). Examples of correctly…arrow_forward
- 3. For the following data, x represents year and y is the sheep population. Construct a divided difference table. Choose an appropriate low-order polynomial and fit using least-squares criterion of best fit. Graph the model, the data points, and the deviations. 1814 1824 1834 1844 1854 1864 1874 1301 1200 | 2703 4801 7504 10799 14702arrow_forwardA survey about social media reported that 82% of B2B marketers (marketers that focus primarily on attracting businesses) plan to increase their use of social media, as compared to 55% of B2C marketers (marketers that primarily target consumers). The survey was based on 1,286 B2B marketers and 1,731 B2C marketers. The accompanying table summarizes the results. Complete parts (a) through (d) below. A. What is the probability that a randomly selected respondent is a B2C marketer? B. What is the probability that a randomly selected respondent plans to increase use of social media or is a B2C marketer? C. Explain the difference in the results in (a) and (b)arrow_forwardSecure Cloud Access 3.2 Hmwk- Polynomial Fu.. Desmos | Graphing Calcul. benefits of e-lsarning-Go... E-Leaming Bensfits and The growth of a red oak tree is approximated by the function G = -0.003t3 + 0.139t2 + 0.459t 0.838, 2sts 34 where G is the height of the tree (in feet) and t is its age (in years). (a) Use a graphing utility to graph the function. G 60 50 150 40 100 30 20 50 10아 15 20 25 30 35 10 15 20 25 30 35 10 60 50 150 40 30 100arrow_forward
 Algebra & Trigonometry with Analytic GeometryAlgebraISBN:9781133382119Author:SwokowskiPublisher:Cengage