Concept explainers
Capital Structure of any company is the mix of different levels of debt and equity. An optimal capital structure is the appropriate mix of debt and equity, striking a balance between risk and return to achieve the goal of maximizing the price of the firm’s stock. Therefore, a target proportion of capital structure and cost of each financing can be used to determine the WACC of the company.
Weighted Average Cost of Capital (WACC) is the required
Here,
Proportion of debt in the target capital structure “
Proportion of preferred stock in the target capital structure “
Proportion of equity in the target capital structure “
After tax cost of debt, preferred stock,
EPS analysis at a given level of EBIT helps in determining the optimal capital structure of the firm, that is the structure at which the EPS will be the highest.
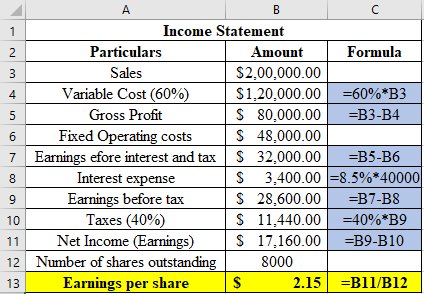
At a sale of $200,000 and debt to total asset ratio of 20%, the company has total assets $200,000, cost of debt 8.5% and number of shares outstanding 8,000.
Explanation of Solution
Income statement of the company is prepared with a debt of $40,000 (20%*$200,000) and interest rate on the debt of 8.5%.

Therefore, when D/TA is 20% and sales is $200,000, the company’s EPS would be
Want to see more full solutions like this?
- Credit Card of America (CCA) has a current ratio of 3.5 and a quick ratio of 3.0. If its total current assets equal $73,500, what are CCA’s (a)current liabilities and (b)inventory?arrow_forwardCalculate the debt-to-equity ratio. Total asset = $1,500,000 Total debts = $1,200,000 Current liabilities = $600,000arrow_forwardA firm has total assets of $638,727, current assets of $203,015, current liabilities of $122,008, and total debt of $348,092. What is the debt-equity ratio? Can you provide the forumla?arrow_forward
- Given the following details, what is OXFORD Inc.'s debt ratio? Sales/Total assets Return on assets Return on equity 1.5x 3% 5%arrow_forwardXYZ Company reported the following information: Total Assets $500,000, Total Liabilities $200,000, and Equity $300,000. Calculate the debt-to-equity ratio and the equity multiplier.arrow_forwardSs stores has total debt of $4910 and a debt equity ratio of 0.52. What is the value of the total assets?arrow_forward
- Compute the following ratios for 2025 and 2024. a. Currentratio b. Inventory turnover. (Inventory on December 31,2023 , was$400.) c. Profit margin. d. Return on assets. (Assets on December 31, 2023, were$2,300.) e. Return on common stockholders' equity. (Stockholders' equity-common on December 31,2023, was$950.) f. Debt to assets ratio. g. Times interest earned.arrow_forwardFollowing are the financial statements of AB Ltd. for 2010. From the aforementioned table, calculate the following: 1. Current ratio 2. Liquid ratio 3. Receivables turnover ratio and collection period 4. Inventory turnover and holding period 5. Fixed assets turnover 6. Total assets turnover 7. Debt ratio 8. D/E ratio 9. Interest coverage ratio 10. PAT margin 11. ROA 12. ROE 13. EPS 14. D/P ratio 15. P/E ratio 16. Book value per sharearrow_forwardBased on the following information as of December 31,2020, compute the company’s debt-equity ratio. Assume current liabilities are all interest-bearing. Round to nearest two decimal places. Current assets: 15 Non-current assets: 12 Current Liabilities: 22 Non-current Liabilities: 4 Debt to Equity Ratio = ?arrow_forward
- Using the attached balanced sheet and income statement Calculate the following ratios for the respective years: 2019, 2020, 2021 est Liquidity Ratios Current Ratio (times) Quick Ratio (times) Asset Management Ratios Average sales/day Inventory Turnover Ratio (times) Days Sales Outstanding (days) Fixed Assets Turnover Ratio (times) Total Asset Turnover Ratio Debt Management Ratios Total Debt to Total Assets (%) Times Interest Earned (times) Debt to Equity Ratio (%) Profitability Ratios Profit Margin on Sales (%) Earning Power (%) Return on Total Assets (%) Return on Common Equity (%) Market Value Ratios Price/Earnings Ratio Price/Earnings Ratio (times) Price/Cash Flow Ratio (times) Market /Book Value Ratio (times) Comment on the liquidity, profitability, leverage, asset management and market valuearrow_forwardView the financial ratios, and write a 100 word minimum analysis in complete sentences interpreting at least one ratio from each category provided. (i.e. select at least one liquidity ratio and one profitability ratio to interpret) Period Ending: 12/31/2020 12/31/2019 12/31/2018 12/31/2017 Liquidity Ratios Current Ratio 188% 113% 83% 86% Quick Ratio 159% 80% 52% 56% Cash Ratio 136% 59% 39% 46% Profitability Ratios Gross Margin 21% 17% 19% 19% Operating Margin 6% 0% 0% 0% Pre-Tax Margin 4% 0% 0% 0% Profit Margin 2% 0% 0% 0% Pre-Tax ROE 5% 0% 0% 0% After Tax ROE 3% 0% 0% 0%arrow_forward17) Based on the balance sheet given for Just Dew It, calculate the following financial ratios for each year: current ratio quick ration cash ratio NWC to total assets ratio debt-equity ratio and equity multiplier Total debt ratio and long-term debt rationarrow_forward
 Managerial Accounting: The Cornerstone of Busines...AccountingISBN:9781337115773Author:Maryanne M. Mowen, Don R. Hansen, Dan L. HeitgerPublisher:Cengage Learning
