Concept explainers
Videos
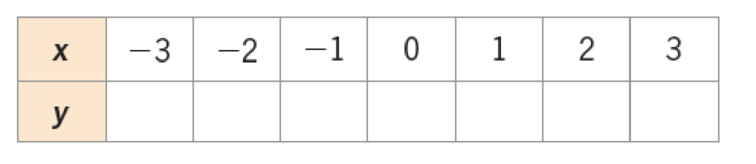
a. Complete the table of values for the function y = x3, plot the values of x and y as points in a coordinate plane, and draw a smooth curve through the points.
b. Graph the function y = x3 with a graphing calculator, using the viewing window
c. Compare the graphs in parts (a) and (b).
Want to see the full answer?
Check out a sample textbook solution
Chapter 1 Solutions
College Algebra in Context with Applications for the Managerial, Life, and Social Sciences (5th Edition)


 Algebra for College StudentsAlgebraISBN:9781285195780Author:Jerome E. Kaufmann, Karen L. SchwittersPublisher:Cengage Learning
 Algebra: Structure And Method, Book 1AlgebraISBN:9780395977224Author:Richard G. Brown, Mary P. Dolciani, Robert H. Sorgenfrey, William L. ColePublisher:McDougal Littell
 Glencoe Algebra 1, Student Edition, 9780079039897...AlgebraISBN:9780079039897Author:CarterPublisher:McGraw Hill
 Algebra & Trigonometry with Analytic GeometryAlgebraISBN:9781133382119Author:SwokowskiPublisher:Cengage
 College AlgebraAlgebraISBN:9781305115545Author:James Stewart, Lothar Redlin, Saleem WatsonPublisher:Cengage Learning
 Trigonometry (MindTap Course List)TrigonometryISBN:9781305652224Author:Charles P. McKeague, Mark D. TurnerPublisher:Cengage Learning