
Videos
CASE STUDY Feeling Lucky? Well, Are You?
In fiscal year (FY) 2013–2014 (July 2013–June 2014), the Florida Lottery generated $5.37 billion in total sales. Over that period, the state spent $37.5 million on advertising to promote its various games. Rand Advertising is interested in gaining access to this lucrative market. You are assigned the task of preparing a report on the lottery sales structure for three of Florida’s online (nonscratch-off ticket) games: Fantasy 5, Lucky Money, and Lotto. Your findings will become part of a proposal by Rand to the Florida Lottery.
In Fantasy 5, a player picks five numbers from 1 to 36, at $1 per play. Drawings are held seven days a week. If there is no jackpot winner for a drawing, the money allocated for the top prize rolls down to the next prize tier (4 of 5).
The Lucky Money game costs $1 per ticket. Players pick four numbers from 1 to 47 and one Lucky Money number from 1 to 22. Drawings are held on Tuesdays and Fridays. If there is no jackpot winner for a drawing, the money allocated for the top prize rolls over to the next drawing, adding to the total of the next jackpot. The prize structures for both games is as shown.
| Prize Structure for Florida’s Fantasy 5 Game | ||
| Match | Estimated Prize Amount per Winner | Probability |
| 5 of 5 | $200,000 |
|
| 4 of 5 | $100 |
|
| 3 of 5 | $10 |
|
| 2 of 5 | Free ticket |
|
| Prize Structure for Florida’s Lucky Money Game | ||
| Match | Estimated Prize Amount per Winner | Probability |
| 4 of 4 + Lucky Ball | $500,000 |
|
| 4 of 4 | $1044 |
|
| 3 of 4 + Lucky Ball | $292 |
|
| 3 of 4 | $71.50 |
|
| 2 of 4 + Lucky Ball | $20 |
|
| 1 of 4 + Lucky Ball | $2.50 |
|
| 2 of 4 | $2 |
|
| 0 of 4 + Lucky Ball | Free ticket |
|
In Lotto, players pick six numbers from 1 to 53, at $1 per play. Drawings are held on Wednesdays and Saturdays. If there is no jackpot winner, the top prize is rolled over to the next drawing. It is difficult to win the Lotto jackpot, so there are numerous jackpot rollovers. Rollovers make it difficult to determine an estimated prize payout per winner. However, the odds structure is shown in the table below.
| Match | Probability |
| 6 of 6 |
|
| 5 of 6 |
|
| 4 of 6 |
|
| 3 of 6 |
|
To conduct your study, you have obtained the sales figures for each of the three games by district sales office for one week. These data are as follows:
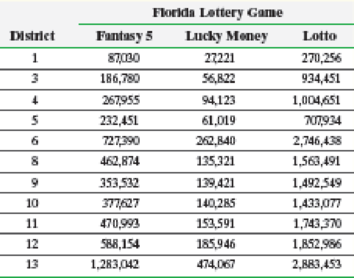
Are the numbers of tickets sold for each lottery game and sales district independent? Construct a bar graph that represents the conditional distribution of game by sales district. Does this graphical evidence support your conclusion regarding the relationship between the type of game and the sales district? Explain.
Additionally, you are interested in the daily sales structure for the various districts. The table on the following page represent the numbers of tickets sold each day for a randomly selected week for the three games in District 1.
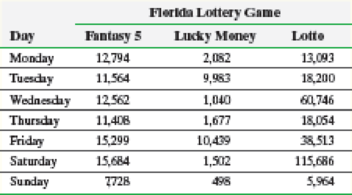
Does the evidence suggest that the proportion of Fantasy 5 sales is the same for each day of the week? Perform a similar test for Lucky Money and Lotto.
Write a report detailing your assumptions, analyses, findings, and conclusions.
Want to see the full answer?
Check out a sample textbook solution
Chapter 12 Solutions
Fundamentals of Statistics (5th Edition)


- According to Zillow.com, the median sale price for homes in January for South Carolina, California, and Virginia over the last three years is given in the table below (measured in $100,000). able South Carolina California Virginia 2018 183 534 98 2019 193 555 94 2020 216 569 85 In South Carolina, realtors take 5.4% of the sale price on average as part of their commission. The average realtor commission rates in California and Virginia are 4.9% and 5.3%, respectively. Use matrix multiplication to find the total earned by realtors from their commissionsarrow_forward13 A business consultant wants to better understand the needs of his clients. He e works with 50 different small businesses but only has the time and resources to collect information from 10 of his clients. For this situation, what would be the best way to collect data? Observational Study Survey Census Experimentarrow_forwardWhat is the stock market? How do you explain its significance to an economy?. The focus of your researched response should be within the Barbados context.arrow_forward
- Stays in Europe and the Mediterranean. The Bureau of Economic Analysis gathers information on the length of stay in Europe and the Mediterranean by U.S. travelers. Data are published in Survey of Current Business. The following stem-and-leaf diagram portrays the length of stay, in days, of a sample of 36 U.S. residents who traveled to Europe and the Mediterranean last year.arrow_forwardSchool Newsletter The school photocopying budget continues to increase and the office manager is looking for ways to cut costs. In the most recent publication of the school newsletter, they invited school families to complete a survey indicating how they currently accessed the school newsletter. The options included as possible responses were: • Printed copy sent home each Thursday • Website link sent through via email or • The school app on their smart phone The survey was optional and allowed participants to select more than one response. If participants completed the survey, they were required to select at least one response, but could select more if applicable. The school has 412 students enrolled from 228 families. The Venn diagram below shows the survey results. Printed II. 34 families did not respond to the survey. 41 1. 102 families indicated they view the newsletter via email link and/or the school app, but not a printed copy. III. 21 families' responses indicated that they…arrow_forwardAn insurance company offers four different deductible levels-none, low, medium, and high-for its homeowner's policyholders and three different levels-low, medium, and high-for its automobile policyholders. The accompanying table gives proportions for the various categories of policyholders who have both types of insurance. For example, the proportion of individuals with both low homeowner's deductible and low auto deductible is 0.08 (8% of all such individuals). Homeowner's Auto N L H 0.04 0.08 0.05 0.02 M 0.07 0.11 0.20 0.08 0.02 0.03 0.15 0.15 Suppose an individual having both types of policies is randomly selected. (a) What is the probability that the individual has a medium auto deductible and a high homeowner's deductible? 0.08 (b) What is the probability that the individual has a low auto deductible? A low homeowner's deductible? auto deductible 0.10 homeowner's deductible 0.22 (c) What is the probability that the individual is in the same category for both auto and homeowner's…arrow_forward
- An insurance company offers four different deductible levels-none, low, medium, and high-for its homeowner's policyholders and three different levels-low, medium, and high-for its automobile policyholders. The accompanying table gives proportions for the various categories of policyholders who have both types of insurance. For example, the proportion of individuals with both low homeowner's deductible and low auto deductible is 0.08 (8% of all such individuals). Homeowner's N L M H Auto 0.04 0.08 0.05 0.01 0.07 0.11 0.20 0.09 н 0.02 0.03 0.15 0.15 Suppose an individual having both types of policies is randomly selected. (a) What is the probability that the individual has a medium auto deductible and a high homeowner's deductible? (b) What is the probability that the individual has a low auto deductible? A low homeowner's deductible? auto deductible homeowner's deductible (c) What is the probability that the individual is in the same category for both auto and homeowner's deductibles?…arrow_forwardAn insurance company offers four different deductible levels-none, low, medium, and high-for its homeowner's policyholders and three different levels-low, medium, and high-for its automobile policyholders. The accompanying table gives proportions for the various categories of policyholders who have both types of insurance. For example, the proportion of individuals with both low homeowner's deductible and low auto deductible is 0.08 (8% of all such individuals). Homeowner's Auto N L H L 0.04 0.08 0.05 0.02 0.07 0.11 0.20 0.08 H. 0.02 0.03 0.15 0.15 Suppose an individual having both types of policies is randomly selected. What is the probability that the individual has a medium auto deductible and a high homeowner's deductible? What is the probability that the individual has a low auto deductible? A low homeowner's deductible? auto deductible homeowner's deductible What is the probability that the individual is in the same category for both auto and homeowner's deductibles? Based on…arrow_forwardAn insurance company offers four different deductible levels-none, low, medium, and high-for its homeowner's policyholders and three different levels-low, medium, and high-for its automobile policyholders. The accompanying table gives proportions for the various categories of policyholders who have both types of insurance. For example, the proportion of individuals with both low homeowner's deductible and low auto deductible is 0.07 (7% of all such individuals). Homeowner's Auto N L M H 0.04 0.07 0.05 0.01 M 0.07 0.11 0.20 0.10 H 0.02 0.03 0.15 0.15 Suppose an individual having both types of policies is randomly selected. (a) What is the probability that the individual has a medium auto deductible and a high homeowner's deductible? (b) What is the probability that the individual has a low auto deductible? A low homeowner's deductible? auto deductible homeowner's deductible (c) What is the probability that the individual is in the same category for both auto and homeowner's deductibles?…arrow_forward
 Calculus For The Life SciencesCalculusISBN:9780321964038Author:GREENWELL, Raymond N., RITCHEY, Nathan P., Lial, Margaret L.Publisher:Pearson Addison Wesley,
 Glencoe Algebra 1, Student Edition, 9780079039897...AlgebraISBN:9780079039897Author:CarterPublisher:McGraw Hill
 Big Ideas Math A Bridge To Success Algebra 1: Stu...AlgebraISBN:9781680331141Author:HOUGHTON MIFFLIN HARCOURTPublisher:Houghton Mifflin Harcourt
 Holt Mcdougal Larson Pre-algebra: Student Edition...AlgebraISBN:9780547587776Author:HOLT MCDOUGALPublisher:HOLT MCDOUGAL