
(a)
To find out what are n and p , X have a binomial distribution.
(a)
Answer to Problem 12.35E
Explanation of Solution
In the question, it is given that the West African country of Guinea has the highest rate of malaria in the world with
(b)
To find out what are the possible values that X can take.
(b)
Answer to Problem 12.35E
Explanation of Solution
In the question, it is given that the West African country of Guinea has the highest rate of malaria in the world with
Thus, the possible values for X will be as:
(c)
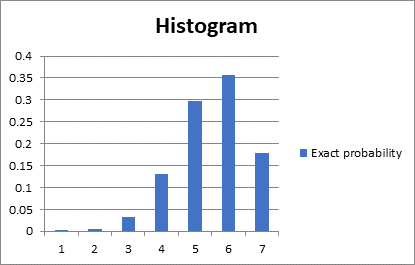
To find the probability of each value of X and draw a probability histogram of X .
(c)
Answer to Problem 12.35E
| X | Exact probability |
| 0 | 0.000244 |
| 1 | 0.004395 |
| 2 | 0.032959 |
| 3 | 0.131836 |
| 4 | 0.296631 |
| 5 | 0.355957 |
| 6 | 0.177979 |
Explanation of Solution
In the question, it is given that the West African country of Guinea has the highest rate of malaria in the world with
Thus, the probability of each value of X can be calculated by using the binomial excel
In the cumulative, the FALSE gives the exact value and TRUE gives the less than value.
Thus, the calculation will be as:
| X | Exact probability |
| 0 | =BINOM.DIST(AJ116,6,0.75,FALSE) |
| 1 | =BINOM.DIST(AJ117,6,0.75,FALSE) |
| 2 | =BINOM.DIST(AJ118,6,0.75,FALSE) |
| 3 | =BINOM.DIST(AJ119,6,0.75,FALSE) |
| 4 | =BINOM.DIST(AJ120,6,0.75,FALSE) |
| 5 | =BINOM.DIST(AJ121,6,0.75,FALSE) |
| 6 | =BINOM.DIST(AJ122,6,0.75,FALSE) |
The result will be as:
| X | Exact probability |
| 0 | 0.000244 |
| 1 | 0.004395 |
| 2 | 0.032959 |
| 3 | 0.131836 |
| 4 | 0.296631 |
| 5 | 0.355957 |
| 6 | 0.177979 |
Thus, the probability histogram of X will be as:
(d)
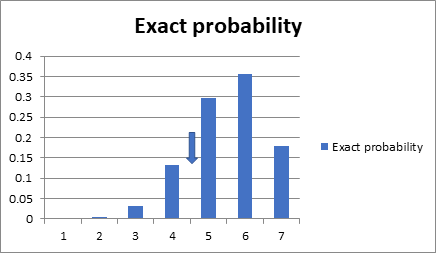
To find out what are the mean and standard deviation of this distribution and mark the location of the mean on your histogram.
(d)
Answer to Problem 12.35E
The mean is
Explanation of Solution
In the question, it is given that the West African country of Guinea has the highest rate of malaria in the world with
Thus, the mean and standard deviation of this distribution will be calculated as:
Thus, the mean in the histogram is shown as:
Want to see more full solutions like this?
Chapter 12 Solutions
Practice of Statistics in the Life Sciences

 MATLAB: An Introduction with ApplicationsStatisticsISBN:9781119256830Author:Amos GilatPublisher:John Wiley & Sons Inc
 Probability and Statistics for Engineering and th...StatisticsISBN:9781305251809Author:Jay L. DevorePublisher:Cengage Learning
 Statistics for The Behavioral Sciences (MindTap C...StatisticsISBN:9781305504912Author:Frederick J Gravetter, Larry B. WallnauPublisher:Cengage Learning
 Elementary Statistics: Picturing the World (7th E...StatisticsISBN:9780134683416Author:Ron Larson, Betsy FarberPublisher:PEARSON
 The Basic Practice of StatisticsStatisticsISBN:9781319042578Author:David S. Moore, William I. Notz, Michael A. FlignerPublisher:W. H. Freeman
 Introduction to the Practice of StatisticsStatisticsISBN:9781319013387Author:David S. Moore, George P. McCabe, Bruce A. CraigPublisher:W. H. Freeman