
An Introduction to Statistical Methods and Data Analysis
7th Edition
ISBN: 9781305269477
Author: R. Lyman Ott, Micheal T. Longnecker
Publisher: Cengage Learning
expand_more
expand_more
format_list_bulleted
Concept explainers
Videos
Textbook Question
Chapter 11.9, Problem 3E
Use the data given here to answer the following questions.
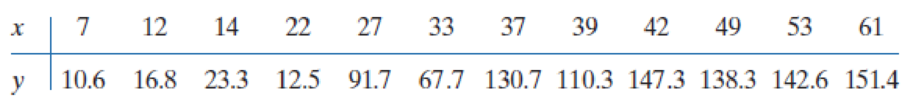
- a. Plot the data values in a
scatter diagram . - b. Sketch a straight line through the points.
- c. Use your sketched line to predict the value of y when x = 40.
Expert Solution & Answer

Trending nowThis is a popular solution!

Chapter 11 Solutions
An Introduction to Statistical Methods and Data Analysis
Ch. 11.9 - Prob. 1ECh. 11.9 - Refer to Exercise 11.1.
Plot the equation in the...Ch. 11.9 - Use the data given here to answer the following...Ch. 11.9 - Prob. 4ECh. 11.9 - Use the output from Minitab for these data to...Ch. 11.9 - A food processor was receiving complaints from its...Ch. 11.9 - An online retailer needs to manage the amount of...Ch. 11.9 - A manufacturer of cases for sound equipment...Ch. 11.9 - Refer to the data of Exercise 11.7. a. Calculate a...Ch. 11.9 - Refer to the data of Exercise 11.8.
Calculate a...
Ch. 11.9 - Refer to the data of Exercise 11.8.
Calculate a...Ch. 11.9 - Athletes are constantly seeking measures of the...Ch. 11.9 - A firm that prints automobile bumper stickers...Ch. 11.9 - A chemist is interested in determining the weight...Ch. 11.9 - Refer to Exercise 11.22 to complete the following....Ch. 11.9 - Prob. 40ECh. 11.9 - A survey of MBA, graduates of a business school...Ch. 11.9 - Refer to the data in Exercise 11.44.
Determine the...Ch. 11.9 - There has been an increasing emphasis in recent...Ch. 11.9 - An air conditioning company responds to calls...Ch. 11.9 - Refer to Exercise 11.61. a. Calculate the...Ch. 11.9 - Refer to Exercise 11.61.
Test for lack of fit for...Ch. 11.9 - Refer to Exercise 11.61.
Compute the standard...Ch. 11.9 - Prob. 93SE
Knowledge Booster


Learn more about
Need a deep-dive on the concept behind this application? Look no further. Learn more about this topic, statistics and related others by exploring similar questions and additional content below.Similar questions
Recommended textbooks for you
 Holt Mcdougal Larson Pre-algebra: Student Edition...AlgebraISBN:9780547587776Author:HOLT MCDOUGALPublisher:HOLT MCDOUGAL
 Glencoe Algebra 1, Student Edition, 9780079039897...AlgebraISBN:9780079039897Author:CarterPublisher:McGraw Hill
 College Algebra (MindTap Course List)AlgebraISBN:9781305652231Author:R. David Gustafson, Jeff HughesPublisher:Cengage Learning
 Mathematics For Machine TechnologyAdvanced MathISBN:9781337798310Author:Peterson, John.Publisher:Cengage Learning,
 Algebra & Trigonometry with Analytic GeometryAlgebraISBN:9781133382119Author:SwokowskiPublisher:Cengage
 Functions and Change: A Modeling Approach to Coll...AlgebraISBN:9781337111348Author:Bruce Crauder, Benny Evans, Alan NoellPublisher:Cengage Learning
Holt Mcdougal Larson Pre-algebra: Student Edition...
Algebra
ISBN:9780547587776
Author:HOLT MCDOUGAL
Publisher:HOLT MCDOUGAL
Glencoe Algebra 1, Student Edition, 9780079039897...
Algebra
ISBN:9780079039897
Author:Carter
Publisher:McGraw Hill
College Algebra (MindTap Course List)
Algebra
ISBN:9781305652231
Author:R. David Gustafson, Jeff Hughes
Publisher:Cengage Learning
Mathematics For Machine Technology
Advanced Math
ISBN:9781337798310
Author:Peterson, John.
Publisher:Cengage Learning,
Algebra & Trigonometry with Analytic Geometry
Algebra
ISBN:9781133382119
Author:Swokowski
Publisher:Cengage
Functions and Change: A Modeling Approach to Coll...
Algebra
ISBN:9781337111348
Author:Bruce Crauder, Benny Evans, Alan Noell
Publisher:Cengage Learning
Correlation Vs Regression: Difference Between them with definition & Comparison Chart; Author: Key Differences;https://www.youtube.com/watch?v=Ou2QGSJVd0U;License: Standard YouTube License, CC-BY
Correlation and Regression: Concepts with Illustrative examples; Author: LEARN & APPLY : Lean and Six Sigma;https://www.youtube.com/watch?v=xTpHD5WLuoA;License: Standard YouTube License, CC-BY