MATH.STATISTICS W/APPL.>CUSTOM<
7th Edition
ISBN: 9781285923789
Author: Wackerly
Publisher: CENGAGE C
expand_more
expand_more
format_list_bulleted
Concept explainers
Videos
Textbook Question
Chapter 11.7, Problem 46E
Refer to Exercise 11.16. Find a 95% prediction interval for the potency of a 1-ounce portion of antibiotic stored at 65◦F. Compare this interval to that calculated in Exercise 11.39.
11.16 An experiment was conducted to observe the effect of an increase in temperature on the potency of an antibiotic. Three 1-ounce portions of the antibiotic were stored for equal lengths of time at each of the following Fahrenheit temperatures: 30◦, 50◦, 70◦, and 90◦. The potency readings observed at the end of the experimental period were as shown in the following table.
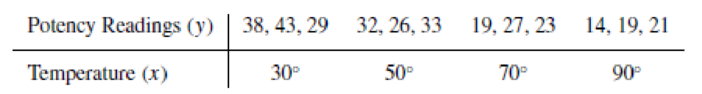
- a Find the least-squares line appropriate for this data.
- b Plot the points and graph the line as a check on your calculations.
- c Calculate S2.
11.39 Refer to Exercise 11.16. Find a 95% confidence interval for the mean potency of a 1-ounce portion of antibiotic stored at 65◦F.
Expert Solution & Answer
Want to see the full answer?
Check out a sample textbook solution
Students have asked these similar questions
In 2016 the Better Business Bureau settled 85% of complaints they received in the United States. Suppose you have been hired by the Better Business Bureau to investigate the
complaints they received this year involving new car dealers. You plan to select a sample of new car dealer complaints to estimate the proportion of complaints the Better Business
Bureau is able to settle. Assume the population proportion of complaints settled for new car dealers is 0.85, the same as the overall proportion of complaints settled in 2016. Use th
z-table.
a. Suppose you select a sample of 200 complaints involving new car dealers. Show the sampling distribution of p.
E(7) =
0.85
(to 2 decimals)
oF = 0.0253
(to 4 decimals)
b. Based upon a sample of 200 complaints, what is the probability that the sample proportion will be within 0.02 of the population proportion (to 4 decimals)?
probability = 0.3079
c. Suppose you select a sample of 500 complaints involving new car dealers. Show the sampling…
“Normal” BMI is up to 25 kg/m2. A laboratory study is being conducted to determine energy expenditure for those who are overweight and/or obese. The researchers have enrolled only subjects with BMI above 25.0 and have quantified obesity as “units above normal”. For example, a subject with BMI of 32.3 is recorded as 7.3 (i.e. 32.3 – 25.0 = 7.3). Using this scheme, the mean obesity was found to be 8.7 kg/m2and the standard deviation was 6.4 kg/m2. If we convert the obesity measure used in this study back into conventional BMI (i.e., add 25.0 units to each measurement), what will the standard deviation be?
Group of answer choices
The standard deviation will be larger on the BMI scale because 25.0 units will be added back.
The standard deviation will be the same 6.4 kg/m2
There is not enough information to determine this
The standard deviation will be smaller on the BMI scale because, as a percentage of the whole scale, the difference between each subject and the mean will be…
A researcher records the following times (in seconds) that it took a group of students to complete an exam: 18 ± 2 min (M ± SD). How long did it take 80% of students to complete the exam?
Select one:
a. less than 16 min
b. 16.32 min
c. less than 18 min
d. 19.68 min
Chapter 11 Solutions
MATH.STATISTICS W/APPL.>CUSTOM<
Ch. 11.3 - If 0 and 1 are the least-squares estimates for the...Ch. 11.3 - Prob. 2ECh. 11.3 - Fit a straight line to the five data points in the...Ch. 11.3 - Auditors are often required to compare the audited...Ch. 11.3 - Prob. 5ECh. 11.3 - Applet Exercise Refer to Exercises 11.2 and 11.5....Ch. 11.3 - Prob. 7ECh. 11.3 - Laboratory experiments designed to measure LC50...Ch. 11.3 - Prob. 9ECh. 11.3 - Suppose that we have postulated the model...
Ch. 11.3 - Some data obtained by C.E. Marcellari on the...Ch. 11.3 - Processors usually preserve cucumbers by...Ch. 11.3 - J. H. Matis and T. E. Wehrly report the following...Ch. 11.4 - a Derive the following identity:...Ch. 11.4 - An experiment was conducted to observe the effect...Ch. 11.4 - Prob. 17ECh. 11.4 - Prob. 18ECh. 11.4 - A study was conducted to determine the effects of...Ch. 11.4 - Suppose that Y1, Y2,,Yn are independent normal...Ch. 11.4 - Under the assumptions of Exercise 11.20, find...Ch. 11.4 - Prob. 22ECh. 11.5 - Use the properties of the least-squares estimators...Ch. 11.5 - Do the data in Exercise 11.19 present sufficient...Ch. 11.5 - Use the properties of the least-squares estimators...Ch. 11.5 - Let Y1, Y2, . . . , Yn be as given in Exercise...Ch. 11.5 - Prob. 30ECh. 11.5 - Using a chemical procedure called differential...Ch. 11.5 - Prob. 32ECh. 11.5 - Prob. 33ECh. 11.5 - Prob. 34ECh. 11.6 - For the simple linear regression model Y = 0 + 1x...Ch. 11.6 - Prob. 36ECh. 11.6 - Using the model fit to the data of Exercise 11.8,...Ch. 11.6 - Refer to Exercise 11.3. Find a 90% confidence...Ch. 11.6 - Refer to Exercise 11.16. Find a 95% confidence...Ch. 11.6 - Refer to Exercise 11.14. Find a 90% confidence...Ch. 11.6 - Prob. 41ECh. 11.7 - Suppose that the model Y=0+1+ is fit to the n data...Ch. 11.7 - Prob. 43ECh. 11.7 - Prob. 44ECh. 11.7 - Prob. 45ECh. 11.7 - Refer to Exercise 11.16. Find a 95% prediction...Ch. 11.7 - Refer to Exercise 11.14. Find a 95% prediction...Ch. 11.8 - The accompanying table gives the peak power load...Ch. 11.8 - Prob. 49ECh. 11.8 - Prob. 50ECh. 11.8 - Prob. 51ECh. 11.8 - Prob. 52ECh. 11.8 - Prob. 54ECh. 11.8 - Prob. 55ECh. 11.8 - Prob. 57ECh. 11.8 - Prob. 58ECh. 11.8 - Prob. 59ECh. 11.8 - Prob. 60ECh. 11.9 - Refer to Example 11.10. Find a 90% prediction...Ch. 11.9 - Prob. 62ECh. 11.9 - Prob. 63ECh. 11.9 - Prob. 64ECh. 11.9 - Prob. 65ECh. 11.10 - Refer to Exercise 11.3. Fit the model suggested...Ch. 11.10 - Prob. 67ECh. 11.10 - Fit the quadratic model Y=0+1x+2x2+ to the data...Ch. 11.10 - The manufacturer of Lexus automobiles has steadily...Ch. 11.10 - a Calculate SSE and S2 for Exercise 11.4. Use the...Ch. 11.12 - Consider the general linear model...Ch. 11.12 - Prob. 72ECh. 11.12 - Prob. 73ECh. 11.12 - An experiment was conducted to investigate the...Ch. 11.12 - Prob. 75ECh. 11.12 - The results that follow were obtained from an...Ch. 11.13 - Prob. 77ECh. 11.13 - Prob. 78ECh. 11.13 - Prob. 79ECh. 11.14 - Prob. 80ECh. 11.14 - Prob. 81ECh. 11.14 - Prob. 82ECh. 11.14 - Prob. 83ECh. 11.14 - Prob. 84ECh. 11.14 - Prob. 85ECh. 11.14 - Prob. 86ECh. 11.14 - Prob. 87ECh. 11.14 - Prob. 88ECh. 11.14 - Refer to the three models given in Exercise 11.88....Ch. 11.14 - Prob. 90ECh. 11.14 - Prob. 91ECh. 11.14 - Prob. 92ECh. 11.14 - Prob. 93ECh. 11.14 - Prob. 94ECh. 11 - At temperatures approaching absolute zero (273C),...Ch. 11 - A study was conducted to determine whether a...Ch. 11 - Prob. 97SECh. 11 - Prob. 98SECh. 11 - Prob. 99SECh. 11 - Prob. 100SECh. 11 - Prob. 102SECh. 11 - Prob. 103SECh. 11 - An experiment was conducted to determine the...Ch. 11 - Prob. 105SECh. 11 - Prob. 106SECh. 11 - Prob. 107SE
Knowledge Booster


Learn more about
Need a deep-dive on the concept behind this application? Look no further. Learn more about this topic, statistics and related others by exploring similar questions and additional content below.Similar questions
- Find the mean hourly cost when the cell phone described above is used for 240 minutes.arrow_forwardEstimate the age of a newly discovered fossil for which the ratio of carbon-14 to carbon-12 is R=1/1014.arrow_forwardIn 1906, San Francisco experienced an intense earthquake with a magnitude of 7.8 on the Richter scale. In 1989, the Loma Prieta earthquake also affected the San Francisco area, and measured 6.9 on the Richter scale. Compare the intensities of the two earthquakes.arrow_forward
- What does the y -intercept on the graph of a logistic equation correspond to for a population modeled by that equation?arrow_forwardDoes a linear, exponential, or logarithmic model best fit the data in Table 2? Find the model.arrow_forwardJordan has average precipitation of 111 mm per year. On a random week in Jordan, what is the expected rainfall as measured in inches per week? Use your E(aX+b) formula, and the fact that 1 mm is equal to 0.0393701 inches, and there are 52.1429 weeks in a year. (Round your answers to two decimal places; ex: 1.23).arrow_forward
- For each 1000-foot increase in elevation, how many fewer frost-free days are predicted. We want to determine how many fewer frost-free days are predicted when the elevation increases by 1000 ft. Predictor Coef SE Coef T PConstant 316.27 28.31 11.24 0.002Elevation -32.660 3.511 −8.79 0.003S = 11.8603 R-Sq = 95.1% Here, ŷ is the number of frost-free days and the variable x is the elevation measured in thousands of feet. Therefore, each 1000 ft increase in elevation results in a 1 unit increase in x. fill in the blank in part a/part b. a) Recall that the slope of a least-squares line, ŷ = a + bx, indicates how much ŷ changes when x changes by 1 unit. In part (a), we determined the slope of the line is b = −32.660. This means that for each unit that x increases, the value of ŷ decreases by _______ units. b) Therefore, when the elevation increases by 1000 ft there are _______ fewer frost-free days.arrow_forwardThe lifetime X of an alkaline battery is exponentially distributed with λ = 0.02 per hour. What are the mean and standarddeviation of the battery’s lifetime?Select one:a. 50b. 25c. 0.02d. 1arrow_forwardI got the t statistic as 27.0875 using the formula, b1- beta1/Sb1. I know the correct answer is D. But I am not sure how to calculate it by hand.arrow_forward
- Which EWMA chart below will yield ARL performance most close to that of cusum chart with k=1/2 and h=5? a. L=2.814, lamda=0.10 b. L=2.615, lamda=0.05 c. L=2.998, lamda=0.25 d. L=3.054, lamda=0.40 e. L=2.962, lamda=0.20arrow_forwardThe toco toucan, the largest member of the toucan family, possesses the largest beak relative to body size of all birds. This exaggerated feature has received various interpretations, such as being a refined adaptation for feeding. However, the large surface area may also be an important mechanism for radiating heat (and hence cooling the bird) as outdoor temperature increases. Presented is the data for beak heat loss, as a percent of total body heat loss from all sources, at various temperatures in degrees Celsius. [Note: The numerical values in this problem have been modified for testing purposes.] Temperature (°C) 1515 1616 1717 1818 1919 2020 2121 2222 2323 2424 2525 2626 2727 2828 2929 3030 Percent heat loss from beak 3232 3636 3636 3333 3535 4747 5757 5151 4242 5353 4646 5252 5959 5959 6363 6262 (a) What is the equation of the least‑squares regression line for predicting beak heat loss, as a percent of total body heat loss from all sources, from temperature? (Use…arrow_forward1. Estimate the common logarithm of 10 using linear interpolation. a. Interpolate between log 8 = 0.9030900 and log 12 = 1.0791812. b. Interpolate between log 9 = 0.9542425 and log 11 = 1.0413927. For each of the interpolations, compute the percent relative error based on the true value. 2. Fit a second-order Newton's Interpolating Polynomial to estimate log 10 using the data from problem at x = 8, 9 and 11. Compute the true percent relative error. 3. Fit a third-order Newton's Interpolating Polynomial to estimate log 10 using the data from Problem 1. 4. Repeat Problems 1 through 3 using the Lagrange Polynomial.arrow_forward
arrow_back_ios
SEE MORE QUESTIONS
arrow_forward_ios
Recommended textbooks for you

 Glencoe Algebra 1, Student Edition, 9780079039897...AlgebraISBN:9780079039897Author:CarterPublisher:McGraw Hill
 Algebra & Trigonometry with Analytic GeometryAlgebraISBN:9781133382119Author:SwokowskiPublisher:Cengage
 Algebra for College StudentsAlgebraISBN:9781285195780Author:Jerome E. Kaufmann, Karen L. SchwittersPublisher:Cengage Learning
 College Algebra (MindTap Course List)AlgebraISBN:9781305652231Author:R. David Gustafson, Jeff HughesPublisher:Cengage Learning
Glencoe Algebra 1, Student Edition, 9780079039897...
Algebra
ISBN:9780079039897
Author:Carter
Publisher:McGraw Hill
Algebra & Trigonometry with Analytic Geometry
Algebra
ISBN:9781133382119
Author:Swokowski
Publisher:Cengage
Algebra for College Students
Algebra
ISBN:9781285195780
Author:Jerome E. Kaufmann, Karen L. Schwitters
Publisher:Cengage Learning
College Algebra (MindTap Course List)
Algebra
ISBN:9781305652231
Author:R. David Gustafson, Jeff Hughes
Publisher:Cengage Learning
Statistics 4.1 Point Estimators; Author: Dr. Jack L. Jackson II;https://www.youtube.com/watch?v=2MrI0J8XCEE;License: Standard YouTube License, CC-BY
Statistics 101: Point Estimators; Author: Brandon Foltz;https://www.youtube.com/watch?v=4v41z3HwLaM;License: Standard YouTube License, CC-BY
Central limit theorem; Author: 365 Data Science;https://www.youtube.com/watch?v=b5xQmk9veZ4;License: Standard YouTube License, CC-BY
Point Estimate Definition & Example; Author: Prof. Essa;https://www.youtube.com/watch?v=OTVwtvQmSn0;License: Standard Youtube License
Point Estimation; Author: Vamsidhar Ambatipudi;https://www.youtube.com/watch?v=flqhlM2bZWc;License: Standard Youtube License