
Concept explainers
Videos
NW Ramp Metering Ramp metering is a traffic engineering idea that requires cars entering a freeway to stop for a certain period of time before joining the traffic flow. The theory is that ramp metering controls the number of cars on the freeway and the number of cars accessing the freeway, resulting in a freer flow of cars, which ultimately results in faster travel times. To test whether ramp metering is effective in reducing travel times, engineers in Minneapolis, Minnesota, conducted an experiment in which a section of freeway had ramp meters installed on the on-ramps. The response variable for the study was speed of the vehicles. A random sample of 15 cars on the highway for a Monday at 6 P.M. with the ramp meters on and a second random sample of 15 cars on a different Monday at 6 P.M. with the meters off resulted in the following speeds (in miles per hour).
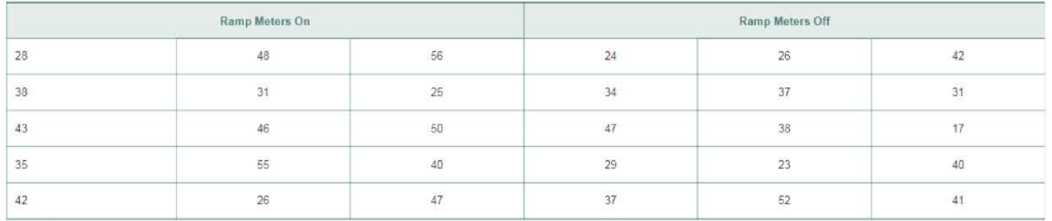
- a. Draw side-by-side boxplots of each data set. Does there appear to be a difference in the speeds? Are there any outliers?
- b. Are the ramp meters effective in maintaining a higher speed on the freeway? Use the α = 0.10 level of significance.
Want to see the full answer?
Check out a sample textbook solution
Chapter 11 Solutions
Fundamentals of Statistics (5th Edition)


- Cholesterol Cholesterol in human blood is necessary, but too much can lead to health problems. There are three main types of cholesterol: HDL (high-density lipoproteins), LDL (low-density lipoproteins), and VLDL (very low-density lipoproteins). HDL is considered “good” cholesterol; LDL and VLDL are considered “bad” cholesterol. A standard fasting cholesterol blood test measures total cholesterol, HDL cholesterol, and triglycerides. These numbers are used to estimate LDL and VLDL, which are difficult to measure directly. Your doctor recommends that your combined LDL/VLDL cholesterol level be less than 130 milligrams per deciliter, your HDL cholesterol level be at least 60 milligrams per deciliter, and your total cholesterol level be no more than 200 milligrams per deciliter. (a) Write a system of linear inequalities for the recommended cholesterol levels. Let x represent the HDL cholesterol level, and let y represent the combined LDL VLDL cholesterol level. (b) Graph the system of inequalities from part (a). Label any vertices of the solution region. (c) Is the following set of cholesterol levels within the recommendations? Explain. LDL/VLDL: 120 milligrams per deciliter HDL: 90 milligrams per deciliter Total: 210 milligrams per deciliter (d) Give an example of cholesterol levels in which the LDL/VLDL cholesterol level is too high but the HDL cholesterol level is acceptable. (e) Another recommendation is that the ratio of total cholesterol to HDL cholesterol be less than 4 (that is, less than 4 to 1). Identify a point in the solution region from part (b) that meets this recommendation, and explain why it meets the recommendation.arrow_forwardThe ordered pairs below give the median sales prices y (in thousands of dollars) of new homes sold in a neighborhood from 2009 through 2016. (2009, 179.4) (2011, 191.0) (2013, 202.6) (2015, 214.9) (2010, 185.4) (2012, 196.7) (2014, 208.7) (2016, 221.4) A linear model that approximates the data is y=5.96t+125.5,9t16, where t represents the year, with t=9 corresponding to 2009. Plot the actual data and the model on the same graph. How closely does the model represent the data?arrow_forward

 Calculus For The Life SciencesCalculusISBN:9780321964038Author:GREENWELL, Raymond N., RITCHEY, Nathan P., Lial, Margaret L.Publisher:Pearson Addison Wesley,
 Algebra & Trigonometry with Analytic GeometryAlgebraISBN:9781133382119Author:SwokowskiPublisher:Cengage
 Big Ideas Math A Bridge To Success Algebra 1: Stu...AlgebraISBN:9781680331141Author:HOUGHTON MIFFLIN HARCOURTPublisher:Houghton Mifflin Harcourt