
Elementary Statistics: Picturing the World (7th Edition)
7th Edition
ISBN: 9780134683744
Author: Larson
Publisher: PEARSON
expand_more
expand_more
format_list_bulleted
Videos
Textbook Question
Chapter 11.2, Problem 7E
Performing a Wilcoxon Test In Exercises 3–8,
- (a) identify the claim and state H0 and Ha.
- (b) decide whether to use a Wilcoxon signed-rank test or a Wilcoxon rank sum test.
- (c) find the critical value(s).
- (d) find the test statistic.
- (e) decide whether to reject or fail to reject the null hypothesis.
- (f) interpret the decision in the context of the original claim.
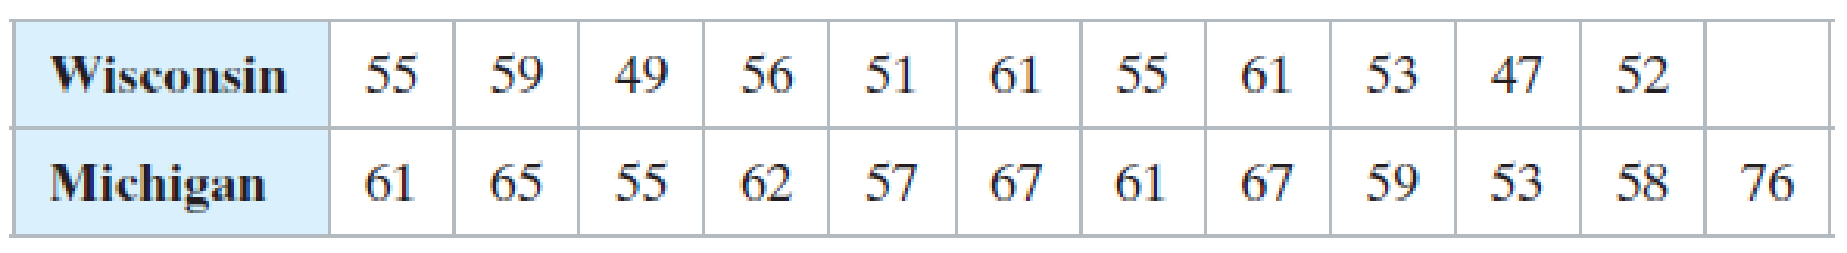
7. Teacher Salaries A teacher’s union representative claims that there is a difference in the salaries earned by teachers in Wisconsin and Michigan. The table shows the salaries (in thousands of dollars) of a random sample of 11 teachers from Wisconsin and 12 teachers from Michigan. At a = 0.05, is there enough evidence to support the representative’s claim? (Adapted from National Education Association)
Expert Solution & Answer
Want to see the full answer?
Check out a sample textbook solution
Students have asked these similar questions
(a) Write the claim mathematically and identify
H0
and
Ha.
(b) Find the standardized test statistic z, and its corresponding area.
(c) Find the P-value.
(d) Decide whether to reject or fail to reject the null hypothesis.
(e) Interpret your decision in the context of the original claim.
Type I and Type I l Errors. In Exercises 29–32, provide statements that identify the type I error and the type II error that correspond to the given claim. (Although conclusions are usually expressed in verbal form, the answers here can be expressed with statements that include symbolic expressions such as p = 0.1.
The proportion of people who require no vision correction is less than 0.25.
Type I and Type I l Errors. In Exercises 29–32, provide statements that identify the type I error and the type II error that correspond to the given claim. (Although conclusions are usually expressed in verbal form, the answers here can be expressed with statements that include symbolic expressions such as p = 0.1.)
The proportion of people with blue eyes is equal to 0.35.
Chapter 11 Solutions
Elementary Statistics: Picturing the World (7th Edition)
Ch. 11.1 - A real estate agency claims that the median number...Ch. 11.1 - An organization claims that the median age of...Ch. 11.1 - A medical researcher claims that a new vaccine...Ch. 11.1 - Prob. 1ECh. 11.1 - When the sign test is used, what population...Ch. 11.1 - Describe the test statistic for the sign test when...Ch. 11.1 - In your own words, explain why the hypothesis test...Ch. 11.1 - Explain how to use the sign test to test a...Ch. 11.1 - List the two conditions that must be met in order...Ch. 11.1 - Performing a Sign Test In Exercises 722, (a)...
Ch. 11.1 - Temperature A meteorologist claims that the median...Ch. 11.1 - Prob. 9ECh. 11.1 - Temperature During a weather report, a...Ch. 11.1 - Credit Card Debt A financial services institution...Ch. 11.1 - Financial Debt A financial services accountant...Ch. 11.1 - Prob. 13ECh. 11.1 - Social Networking A research group claims that the...Ch. 11.1 - Unit Size A renters organization claims that the...Ch. 11.1 - Prob. 16ECh. 11.1 - Hourly Wages A labor organization claims that the...Ch. 11.1 - Prob. 18ECh. 11.1 - Prob. 19ECh. 11.1 - Prob. 20ECh. 11.1 - Prob. 21ECh. 11.1 - Prob. 22ECh. 11.1 - Prob. 23ECh. 11.1 - Contacting Parents A research organization...Ch. 11.1 - In Exercises 2528, use a right-tailed test and (a)...Ch. 11.1 - Prob. 26ECh. 11.1 - Prob. 27ECh. 11.1 - Ages of Grooms A marriage counselor claims that...Ch. 11.2 - A quality control inspector wants to test the...Ch. 11.2 - Prob. 2TYCh. 11.2 - Prob. 1ECh. 11.2 - Prob. 2ECh. 11.2 - Prob. 3ECh. 11.2 - Prob. 4ECh. 11.2 - Prob. 5ECh. 11.2 - Prob. 6ECh. 11.2 - Performing a Wilcoxon Test In Exercises 38, (a)...Ch. 11.2 - Performing a Wilcoxon Test In Exercises 38, (a)...Ch. 11.2 - Wilcoxon Signed-Rank Test for n 30 When you are...Ch. 11.2 - Prob. 10ECh. 11.2 - Construct a side-by-side box-and-whisker plot for...Ch. 11.2 - Prob. 2CSCh. 11.2 - In Exercises 25, use the sign test to test the...Ch. 11.2 - In Exercises 25, use the sign test to test the...Ch. 11.2 - In Exercises 25, use the sign test to test the...Ch. 11.2 - In Exercises 6 and 7, use the Wilcoxon rank sum...Ch. 11.2 - In Exercises 6 and 7, use the Wilcoxon rank sum...Ch. 11.3 - Prob. 1TYCh. 11.3 - Prob. 1ECh. 11.3 - Explain why the Kruskal-Wallis test is always a...Ch. 11.3 - Prob. 3ECh. 11.3 - Performing a Kruskal-Wallis Test In Exercises 36,...Ch. 11.3 - Prob. 5ECh. 11.3 - Prob. 6ECh. 11.3 - Comparing Two Tests In Exercises 7 and 8, (a)...Ch. 11.3 - Comparing Two Tests In Exercises 7 and 8, (a)...Ch. 11.4 - Prob. 1TYCh. 11.4 - Prob. 1ECh. 11.4 - Prob. 2ECh. 11.4 - Prob. 3ECh. 11.4 - Prob. 4ECh. 11.4 - Prob. 5ECh. 11.4 - Prob. 6ECh. 11.4 - Prob. 7ECh. 11.4 - Prob. 8ECh. 11.4 - Prob. 9ECh. 11.4 - Prob. 10ECh. 11.4 - Prob. 11ECh. 11.4 - Prob. 12ECh. 11.4 - Prob. 13ECh. 11.4 - Prob. 14ECh. 11.5 - A machine produces engine parts. An inspector...Ch. 11.5 - Prob. 2TYCh. 11.5 - Prob. 3TYCh. 11.5 - In your own words, explain why the hypothesis test...Ch. 11.5 - Describe the test statistic for the runs test when...Ch. 11.5 - Finding the Number of Runs In Exercises 36,...Ch. 11.5 - Prob. 4ECh. 11.5 - Finding the Number of Runs In Exercises 36,...Ch. 11.5 - Prob. 6ECh. 11.5 - Prob. 7ECh. 11.5 - Prob. 8ECh. 11.5 - Prob. 9ECh. 11.5 - Prob. 10ECh. 11.5 - Finding Critical Values In Exercises 1114, use the...Ch. 11.5 - Prob. 12ECh. 11.5 - Prob. 13ECh. 11.5 - Prob. 14ECh. 11.5 - Prob. 15ECh. 11.5 - Prob. 16ECh. 11.5 - Prob. 17ECh. 11.5 - Prob. 18ECh. 11.5 - Prob. 19ECh. 11.5 - Prob. 20ECh. 11.5 - Prob. 21ECh. 11.5 - Prob. 22ECh. 11.5 - Runs Test with Quantitative Data In Exercises...Ch. 11 - Using an Inappropriate Test Discuss the...Ch. 11 - Prob. 11.1.1RECh. 11 - Prob. 11.1.2RECh. 11 - Prob. 11.1.3RECh. 11 - Prob. 11.1.4RECh. 11 - Prob. 11.1.5RECh. 11 - Prob. 11.1.6RECh. 11 - In Exercises 7 and 8, use a Wilcoxon test to test...Ch. 11 - In Exercises 7 and 8, use a Wilcoxon test to test...Ch. 11 - Prob. 11.3.9RECh. 11 - Prob. 11.3.10RECh. 11 - Prob. 11.4.11RECh. 11 - Prob. 11.4.12RECh. 11 - Prob. 11.5.13RECh. 11 - Prob. 11.5.14RECh. 11 - Prob. 1CQCh. 11 - Prob. 2CQCh. 11 - Prob. 3CQCh. 11 - Prob. 4CQCh. 11 - Prob. 5CQCh. 11 - Prob. 1CTCh. 11 - Prob. 2CTCh. 11 - Prob. 3CTCh. 11 - An employment agency claims that there is a...Ch. 11 - Prob. 5CTCh. 11 - How Would You Do It? (a) What sampling technique...Ch. 11 - In a recent year, according to the Bureau of Labor...Ch. 11 - Prob. 3RSRDCh. 11 - Construct a box-and-whisker plot for each region....Ch. 11 - In Exercises 15, refer to the annual incomes of...Ch. 11 - Use technology to perform a Wilcoxon rank sum test...Ch. 11 - Prob. 4TCh. 11 - Prob. 5TCh. 11 - Prob. 6T
Knowledge Booster


Learn more about
Need a deep-dive on the concept behind this application? Look no further. Learn more about this topic, statistics and related others by exploring similar questions and additional content below.Similar questions
- Use the 4 steps of hypothesis testing to determine if there is a significant relationship between exam scores and average daily miles walked during exam week. (Consider this a 2-tailed test with a = .05) Miles Walked (X) Exam Scores (Y) 7 85 2 76 14 91 8 72 3 87 7 91 5 82 16 86 4 94 11 68 A researcher wants to test whether there is a relationship between gender and voting preferences (Republican, Democrat, or Independent) in a sample of 200 registered voters. The following table shows the observed frequencies for each combination of gender and voting preference. Using a significance level of 0.05, test whether the chi square for independence is significant Republican Democrat Independent Male 30 40 20 solve all step by step clearlyarrow_forwardThe data below were collected to test the effectiveness of a drug to lower systolic blood pressure. Blood pressure (in mm of mercury) was measured before and after treatment for 12 patients; the results are shown. The company claims the drug is effective. Explore this claim through completing the given questions. Assume the population differences is approximately normal and that all conditions for testing are satisfied. Subject A |E F H J G K L Before 200 174 198 170 179 182 193 209 185 155 169 210 After 191 170 177 167 159 151 176 183 159 145 146 177 Before - 9 After 4 21 3 20 31 17 26 26 10 23 33 Blank #1: The individual differences are given because these samples are Fill in the missing parts of the test to show it in its entirety: To explore whether the drug is effective, conduct a significance test using the hypotheses (do before - after as the direction of subtraction) Ho : Hdifference = 0 Ho : Hdifference Blank #2: Determine the correct alternative hypothesis by filling in the…arrow_forwardAnalysis of whether two categorical variables, X = course subject and Y = grade earned by a student was conducted. Researchers selected n = 800 students for their study using m = 4 distinct courses and k = 6 grades, from A to F and W. They evaluated a x2 test statistic for testing independence between X and Y equal to TS = 29.64 At the significance level a = 0.01, do researchers have sufficient evidence that X and Y are dependent? 1. Show critical value (or values) needed for this procedure 2. Formulate the rejection rule 3. State your decision: whether the independence hypothesis should be rejected at the significance level a = 0.01 Solutionarrow_forward
- Select the null hypothesis Ho: Males and females do not differ in the amount of money they have on them Ho: Males and females will differ in the amount of money they have on themarrow_forwardIdentifying H0 and H1 In Exercises 5–8, do the following: a. Express the original claim in symbolic form. b. Identify the null and alternative hypotheses. 5. Claim: Most adults do not have hypertension. When 983 randomly selected adults were tested, it was found that 70.9% of them do not have hypertension.arrow_forwardA researcher selects a sample and administers a treatment for anxiety to the individuals in the sample. If the sample is used for a hypothesis test, what does the null hypothesis (Ho) put forth about the treatment? O The treatment has an effect on anxiety. O The treatment divides each anxiety score by a constant. O The treatment multiplies each anxiety score by a constant. The treatment has no effect on anxiety.arrow_forward
- Chi-square test for independence: The number of people who survived the titanic based on class and sex is collected and attached. Is there enough evidence to show that the class and the sex of a person who survived the titanic are independent? What is the null and alternative hypothesis?arrow_forwardHow to write the hypothesis claim? My claim is students at the university use 10 or more hours of social media weekly. My sample was from 40 studentsarrow_forwardReview: Suppose a hypothesis test produces P = 0.0512 Will the null hypothesis be rejected at α = 0.10? How will the outcome of the test change if the level of significance is changed to 0.05? Explain in 1 – 2 complete sentences.arrow_forward
- Identifying H0 and H1 In Exercises 5–8, do the following: a. Express the original claim in symbolic form. b. Identify the null and alternative hypotheses. Pulse Rates Claim: The mean pulse rate (in beats per minute, or bpm) of adult males is equal to 69 bpm. For the random sample of 153 adult males in Data Set 1 “Body Data” in Appendix B, the mean pulse rate is 69.6 bpm and the standard deviation is 11.3 bpm.arrow_forwardDirections: A 6-sided die is rolled. Let random variable X denote the number that is rolled. Calculate the following probablilities. 1. Pr(X = 3) 2. Pr(X = 6) 3. Pr(X > 2) 4. Pr(X < 3) 5. Pr(X is odd) 6. Pr(X = 0)arrow_forwardusing the sequential steps of hypothesis testingarrow_forward
arrow_back_ios
SEE MORE QUESTIONS
arrow_forward_ios
Recommended textbooks for you
 Algebra & Trigonometry with Analytic GeometryAlgebraISBN:9781133382119Author:SwokowskiPublisher:Cengage
Algebra & Trigonometry with Analytic Geometry
Algebra
ISBN:9781133382119
Author:Swokowski
Publisher:Cengage
Hypothesis Testing using Confidence Interval Approach; Author: BUM2413 Applied Statistics UMP;https://www.youtube.com/watch?v=Hq1l3e9pLyY;License: Standard YouTube License, CC-BY
Hypothesis Testing - Difference of Two Means - Student's -Distribution & Normal Distribution; Author: The Organic Chemistry Tutor;https://www.youtube.com/watch?v=UcZwyzwWU7o;License: Standard Youtube License