
Concept explainers
Videos
(a)
To identify the shape of each distribution.
(a)
Answer to Problem 17E
Symmetric distribution
Explanation of Solution
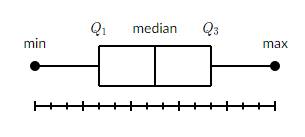
Given information: Box-and-whisker plot.
Calculation:
It is a symmetric distribution. Because a symmetric graph forms a mirror image of itself when reflected in its vertical center line.
(b)
To describe which sales of representatives is more spread out.
(b)
Answer to Problem 17E
Sales B
Explanation of Solution
Given information: Box-and-whisker plot.
Formula Used:Range of the data=
Calculation:
Representative A:
As the range of the data:
So,
Range=
Hence,
Range=
As the Interquartile range of the data =
So,
Interquartile Range=
Hence,
Interquartile Range=
Representative B:
As the range of the data:
So,
Range=
Hence,
Range=
As the Interquartile range of the data =
So,
Interquartile Range=
Hence,
Interquartile Range=
Sales of representatives B is more spread out than that of A.
Because range of the data of B is much greater than interquartile range of B.
(c)
To describe which representatives the single worst sales month during the year.
(c)
Answer to Problem 17E
Sales B
Explanation of Solution
Given information: Box-and-whisker plot.
Calculation:

- Representative A:
Median = 14
- Representative B:
Median = 10
Sales of representatives B had the single worst sales month during the year because its median is too small.
Chapter 11 Solutions
BIG IDEAS MATH Integrated Math 1: Student Edition 2016


 Discrete Mathematics and Its Applications ( 8th I...MathISBN:9781259676512Author:Kenneth H RosenPublisher:McGraw-Hill Education
 Mathematics for Elementary Teachers with Activiti...MathISBN:9780134392790Author:Beckmann, SybillaPublisher:PEARSON
 Thinking Mathematically (7th Edition)MathISBN:9780134683713Author:Robert F. BlitzerPublisher:PEARSON
 Discrete Mathematics With ApplicationsMathISBN:9781337694193Author:EPP, Susanna S.Publisher:Cengage Learning,
 Pathways To Math Literacy (looseleaf)MathISBN:9781259985607Author:David Sobecki Professor, Brian A. MercerPublisher:McGraw-Hill Education