
Concept explainers
Videos
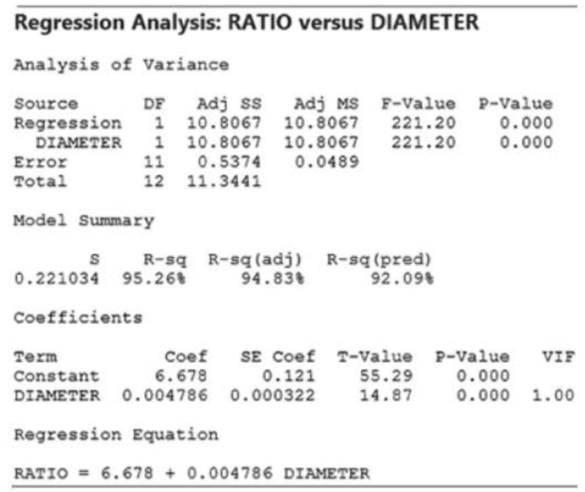
Repair and replacement costs of water pipes. Refer to the IHS Journal of Hydraulic Engineering (September 2012) study of water pipes, Exercise 11.12 (p. 622). Recall that a team of civil engineers used
| Diameter (mm) | Ratio | |
| 80 | 6.58 | |
| 100 | 6.97 | |
| 125 | 7.39 | |
| 150 | 7.61 | |
| 200 | 7.78 | |
| 250 | 7.92 | |
| 300 | 8.20 | |
| 350 | 8.42 | |
| 400 | 8.60 | |
| 450 | 8.97 | |
| 500 | 9.31 | |
| 600 | 9.47 | |
| 700 | 9.72 | |
| Source.· eased on ISH Journal or Hydraulic Engineering, Volume 18, Issue 3, pp 241-251. Copyright September 2012 | ||
a. Find the least squares line relating ratio of repair to replacement cost (y) to pipe diameter (x) on the printout.
b. Locate the value of SSE on the printout. Is there another line with an average error of 0 that has a smaller SSE than the line, part a? Explain.
c. Interpret, practically, the values
d. Use the regression line to predict the ratio of repair to replacement cost of pipe with a diameter of 800 millimeters.
e. Comment on the reliabilrty of the prediction, part d.
Minitab Output for Exercise 11 .21
Want to see the full answer?
Check out a sample textbook solution
Chapter 11 Solutions
EBK STATISTICS FOR BUSINESS AND ECONOMI


- A finance manager employed by an automobile dealership believes that the number of cars sold in his local market can be predicted by the interest rate charged for a loan. Interest Rate (%) Number of Cars Sold (100s) 3 10 5 7 6 5 8 2 The finance manager performed a regression analysis of the number of cars sold and interest rates using the sample of data above. Shown below is a portion of the regression output. Regression Statistics Multiple R 0.998868 R2 0.997738 Coefficient Intercept 14.88462 Interest Rate -1.61538 2. Is interest rate charged for a loan the most important factor to be considered in predicting future car sales? Explain reasoning.The dealership's vice-president of marketing has requested a sales forecast at the prevailing interest rate of 7%. 3. As finance manager, what reasons would you convey to the vice-president in recommending this forecasting model? 4. Is the prediction of car sales…arrow_forwardA finance manager employed by an automobile dealership believes that the number of cars sold in his local market can be predicted by the interest rate charged for a loan. Interest Rate (%) Number of Cars Sold (100s) 3 10 5 7 6 5 8 2 The finance manager performed a regression analysis of the number of cars sold and interest rates using the sample of data above. Shown below is a portion of the regression output. Regression Statistics Multiple R 0.998868 R2 0.997738 Coefficient Intercept 14.88462 Interest Rate -1.61538 1. Are there factors other than interest rate charged for a loan that the finance manager should consider in predicting future car sales? 2. Is interest rate charged for a loan the most important factor to be considered in predicting future car sales? Explain reasoning.The dealership's vice-president of marketing has requested a sales forecast at the prevailing interest rate of 7%. 3. As…arrow_forwardTest Design: Suppose I want to test the impact of soccer coaches on soccer teams. How would you test this? Include a few (3 or 4) independent variables to explain the dependent variable. Describe the data and write the regression equation.arrow_forward
- A finance manager employed by an automobile dealership believes that the number of cars sold in his local market can be predicted by the interest rate charged for a loan. Interest Rate (%) Number of Cars Sold (100s) 3 5 10 7 8 2 The finance manager performed a regression analysis of the number of cars sold and interest rates using the sample of data above. Shown below is a portion of the regression output. Regression Statistics Multiple R0.998868 R2 0.997738 Coefficient |14.88462 Interest Rate -1.61538 Intercept 1. Are there factors other than interest rate charged for a loan that the finance manager should consider in predicting future car sales? 2. Is interest rate charged for a loan the most important factor to be considered in predicting future car sales? Explain your reasoning.The dealership's vice- president of marketing has requested a sales forecast at the prevailing interest rate of 7%. 3. As finance manager, what reasons would you convey to the vice-president in recommending…arrow_forwardXYZ Company's accountant is estimating next period's total overhead costs (Y). She performed three regression analyses, the first is based on direct labor hours (DLH), the second is based on machine hours (Mhr), and the third is based on quantity produced (Q). The results were: [Y=$95,000 + $9×DLH; R-square = 0.85]; [Y= $120,000 + $5xMhr; R-square = 0.15]; [Y=190,000+2Q; R-square=D0.45]. How much of the variations on the overhead costs is explained by the quantity produced (Q)? Select one: O a. 15% O b. None of the answers given C. 55% O d. 85% e. 45%arrow_forwardIn exercise 1, the following estimated regression equation based on 10 observations was presented. y^=29.1270+.5906x1+.4980x2Here SST=6724.125, SSR=6216.375, sb1=.0813, and sb2=.0567. a) Compute MSR and MSE. b) Compute F and perform the appropriate F test. Use α=.05. c) Perform a t test for the significance of β1. Use α=.05. d) Perform a t test for the significance of β2. Use α=.05.arrow_forward
- Regression analysis was applied between $ sales (y) and $ advertising (r) across all the branches of a major international corporation. The following regression function was obtained. ŷ = 5000 + 7.25r (a) Predict the amount for sales where the advertising amount is $ 1,000,000.00. (b) If the advertising budgets of two branches of the corporation differ by $30,000, then what will be the predicted difference in their sales?arrow_forwardShow the graphical form of the econometric error using sample regression line (SRL) and the population regression line(PRL).arrow_forwarda simple linear regression equation shows the relationship between-arrow_forward
- The following data gives the experience of the machine operators and their performance ratings as given by the number of good parts turned out per 100 pieces.Experience(X) 16 12 18 4 3 10 5 12Performance Ratings (Y) 88 87 89 68 78 80 75 83Obtain the regression line of performance ratings on experience and estimate the probable performance if the operator has 7 years of experience.arrow_forwardA marketing analyst wants to examine the relationship between sales (in $1,000s) and advertising (in $100s) for firms in the food and beverage industry and collects monthly data for 25 firms. He estimates the modet: Sales- Bo + B1 Advertising +t. The following table shows a portion of the regression results. Coefficients Standard Error t-stat p-value Intercept 40.10 14.08 2.848 0.0052 Advertising 2.88 1.52 -1.895 0.0608 Which of the following are the competing hypotheses used to test whether the slope coefficient differs from 3? Multiple Choice Ho i bị 3; HAtbi3 Họ ib - 2.88; HAibi 2.88arrow_forwardA guidance counselor wants to determine if there is a relationship between a student's number of absences, x, and their grade point average (GPA), y. The data that were collected are displayed in the scatterplot and the least-squares regression line was calculated. One student with 2 absences has a GPA of 1.8. This point is circled on the graph. GPA and Absences 4.8 4.4 4.0 3.6 3.2 2.8 2.4 2.0 1.6 4 6 8 10 12 14 16 Absences (Days) What effect does the circled point have on the standard deviation of the residuals? This point will increase the value of the standard deviation of the residuals because it has a large positive residual. This point will increase the value of the standard deviation of the residuals because it has a large negative residual. This point will not affect the value of the standard deviation of the residuals because it has a large positive residual. This point will decrease the value of the standard deviation of the residuals because it has a large negative residual.…arrow_forward
 Managerial Economics: Applications, Strategies an...EconomicsISBN:9781305506381Author:James R. McGuigan, R. Charles Moyer, Frederick H.deB. HarrisPublisher:Cengage Learning