
EP STATISTICS F/BUS.+ECON.-ACCESS 18 WK
13th Edition
ISBN: 9780135960912
Author: MCCLAVE
Publisher: PEARSON CO
expand_more
expand_more
format_list_bulleted
Concept explainers
Videos
Textbook Question
Chapter 11.2, Problem 11.16LM
Construct a
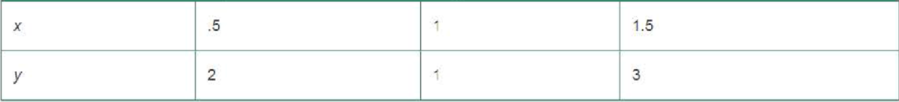
a. Plot the following two lines on your scatterplot:
b. Which of these lines would you choose to characterize the relationship between x and y? Explain.
c. Show that the sum of the errors of prediction for both of these lines equals 0.
d. Which of these lines has the smaller SSE?
e. Find the least squares line for the data and compare it with the two lines described in part a.
Expert Solution & Answer
Want to see the full answer?
Check out a sample textbook solution
Students have asked these similar questions
The table lists weights (pounds) and highway mileage amounts (mpg) for seven automobiles. Use the sample data to construct a scatterplot. Use the first variable for the x-axis.
Based on the scatterplot, what do you conclude about a linear correlation?
Weight (lb)
Highway (mpg)
Which scatterplot below shows the data?
O A.
40-
20+
2000
5000
2855 3050 3810 3985 4250 2275 3525
33
32
27
24
22
39
28
Weight (lb)
Q
Q
O B.
40
20+
2000
AHH
5000
Weight (lb)
Q
Q
Is there a linear relationship between weight and highway mileage?
O A. No, there appears to be a relationship, but it is not linear.
O B. Yes, as the weight increases the highway mileage decreases.
O C. Yes, as the weight increases the highway mileage increases.
OD. No there appears to be no relationshin
C
O C.
Q
40-
M
Q
20++
2000
5000
Weight (lb)
Highway (
O D.
Highway (mpg)
40-
20+
2000
5000
Weight (lb)
Q
1. Solve the following problem by using Excel for graph sketching.
A soda vendor at Louisiana State University football games observes that more sodas
are sold the warmer the temperature at game time is. Based on 32 home games
covering five years, the vendor estimates the relationship between soda sales and
temperature to be y = -240 + 8x, where y = the number of sodas she sells and .x =
temperature in degrees Fahrenheit,
(a) Interpret the estimated slope and intercept. Do the estimates make sense? Why,
or why not?
(b) On a day when the temperature at game time is forecast to be 80°F, predict how
many sodas the vendor will sell.
(c) Below what temperature are the predicted sales zero?
(d) Sketch a graph of the estimated regression line.
GIVEN THE FOLLOWING DATA, COMPUTE FOR THE FOLLOWING:
2. ARITHMETIC GEOMETRIC CURVE
3. STATISTICAL PARABOLIC CURVE
WRITE A RECOMMENDATION REGARDING THE RESULTS AND WHICH OF THE METHOD IS BEST FIT FOR THE DATA.
Chapter 11 Solutions
EP STATISTICS F/BUS.+ECON.-ACCESS 18 WK
Ch. 11.1 - In each case, graph the line that passes through...Ch. 11.1 - Give the slope and y-intercept for each of the...Ch. 11.1 - The equation for a straight line (deterministic...Ch. 11.1 - Refer to Exercise 11.3. Find the equations of the...Ch. 11.1 - Plot the following lines: a. y 4 + x b. y = 5 2x...Ch. 11.1 - Give the slope and y-intercept for each of the...Ch. 11.1 - Prob. 11.7LMCh. 11.1 - Prob. 11.8LMCh. 11.1 - If a straight-line probabilistic relationship...Ch. 11.1 - Congress voting on women's issues. The American...
Ch. 11.1 - Best-paid CEOs. Refer to Glassdoor Economic...Ch. 11.1 - Estimating repair and replacement costs of water...Ch. 11.1 - Forecasting movie revenues with Twitter. A study...Ch. 11.2 - The following table is similar to Table 11.2.It is...Ch. 11.2 - Refer to Exercise 11.14. After the least squares...Ch. 11.2 - Construct a scatterplot for the data in the...Ch. 11.2 - Consider the following pairs of measurements: a....Ch. 11.2 - Use the applet Regression by Eye to explore the...Ch. 11.2 - In business, do nice guys finish first or last?...Ch. 11.2 - State Math SAT scores. Refer to the data on...Ch. 11.2 - Lobster fishing study. Refer to the Bulletin of...Ch. 11.2 - Repair and replacement costs of water pipes. Refer...Ch. 11.2 - Joint Strike Fighter program. The Joint Strike...Ch. 11.2 - Software millionaires and birthdays. In Outliers:...Ch. 11.2 - Prob. 11.24ACICh. 11.2 - Ranking driving performance of professional...Ch. 11.2 - Sweetness of orange juice. The quality of the...Ch. 11.2 - Forecasting movie revenues with Twitter. Marketers...Ch. 11.2 - Charisma of top-level leaders. According to a...Ch. 11.2 - Ran kings of research universities. Refer to the...Ch. 11.2 - Prob. 11.30ACACh. 11.3 - Visually compare the scatterplots shown below. If...Ch. 11.3 - Calculate SSE and s2 for each of the following...Ch. 11.3 - Suppose you fit a least squares line to 26 data...Ch. 11.3 - Refer to Exercise 11.14 (p. 629). Calculate SSE,...Ch. 11.3 - Do nice guys really finish last in business? Refer...Ch. 11.3 - State Math SAT scores. Refer to the simple linear...Ch. 11.3 - Prob. 11.37ACBCh. 11.3 - Prob. 11.38ACBCh. 11.3 - Prob. 11.39ACBCh. 11.3 - Prob. 11.40ACICh. 11.3 - Prob. 11.41ACICh. 11.3 - Sweetness of orange juice. Refer to the study of...Ch. 11.3 - Rankings of research universities. Refer to the...Ch. 11.3 - Life tests of cutting tools. To Improve the...Ch. 11.4 - Construct both a 95% and a 90% confidence interval...Ch. 11.4 - Consider the following pairs of observations: a....Ch. 11.4 - Refer to Exercise 11.46. Construct an 80% and a...Ch. 11.4 - Do the accompanying data provide sufficient...Ch. 11.4 - State Math SAT Scores. Refer to the SPSS simple...Ch. 11.4 - Lobster fishing study. Refer to the Bulletin of...Ch. 11.4 - Prob. 11.51ACBCh. 11.4 - Prob. 11.52ACBCh. 11.4 - Estimating repair and replacement costs of water...Ch. 11.4 - Prob. 11.54ACBCh. 11.4 - Prob. 11.55ACICh. 11.4 - Beauty and electoral success. Are good looks an...Ch. 11.4 - Prob. 11.57ACICh. 11.4 - Prob. 11.58ACICh. 11.4 - Prob. 11.59ACICh. 11.4 - Prob. 11.60ACICh. 11.4 - Rankings of research universities. Refer to the...Ch. 11.4 - Prob. 11.62ACACh. 11.4 - Does elevation impact hitting performance in...Ch. 11.5 - Explain what each of the following sample...Ch. 11.5 - Describe the slope of the least squares line if a....Ch. 11.5 - Construct a scatterplot for each data set. Then...Ch. 11.5 - Calculate r2 for the least squares line in each of...Ch. 11.5 - Use the applet Correlation by Eye to explore the...Ch. 11.5 - In business, do nice guys finish first or last?...Ch. 11.5 - Going for it on fourth-down in the NFL Each week...Ch. 11.5 - Lobster fishing study. Refer to the Bulletin of...Ch. 11.5 - RateMyProfessors.com. A popular Web site among...Ch. 11.5 - Last name and acquisition timing. Refer to the...Ch. 11.5 - Women in top management. An empirical analysis of...Ch. 11.5 - Prob. 11.74ACICh. 11.5 - Prob. 11.75ACICh. 11.5 - Prob. 11.76ACICh. 11.5 - Prob. 11.77ACICh. 11.5 - Prob. 11.78ACICh. 11.5 - Evaluation of an imputation method for missing...Ch. 11.5 - Prob. 11.80ACICh. 11.5 - Prob. 11.81ACACh. 11.6 - Consider the followings of measurements: a...Ch. 11.6 - Consider the pairs of measurements shown in the...Ch. 11.6 - In fitting a least squares line to n = 10 data...Ch. 11.6 - Prob. 11.86ACBCh. 11.6 - Prob. 11.87ACBCh. 11.6 - Prob. 11.88ACBCh. 11.6 - Prob. 11.89ACBCh. 11.6 - Prob. 11.90ACBCh. 11.6 - Prob. 11.91ACICh. 11.6 - Ranking driving performance of professional...Ch. 11.6 - Spreading rate of spilled liquid Refer to the...Ch. 11.6 - Removing nitrogen from toxic wastewater. Highly...Ch. 11.6 - Predicting quit rates In manufacturing The reasons...Ch. 11.6 - Life tests of cutting tools Refer to the data...Ch. 11.7 - Prices of recycled materials. Prices of recycled...Ch. 11.7 - Thickness of dust on solar cells. The performance...Ch. 11.7 - Management research In Africa. The editors of the...Ch. 11.7 - An MBAs work-life balance. The importance of...Ch. 11 - In fitting a least squares line ton= 15 data...Ch. 11 - Consider the following sample data. a. Construct a...Ch. 11 - Consider the following 10 data points. a. Plot the...Ch. 11 - Drug controlled-release rate study. The effect of...Ch. 11 - Metaskills and career management. Effective...Ch. 11 - Burnout of human services professionals. Emotional...Ch. 11 - Retaliation against company whistle-blowers....Ch. 11 - Extending the life of an aluminum smelter pot. An...Ch. 11 - Diamonds sold at retail. Refer to the Journal of...Ch. 11 - Sports news on local TV broadcasts. The Sports...Ch. 11 - Evaluating managerial success. An observational...Ch. 11 - Doctors and ethics. Refer to the Journal of...Ch. 11 - FCAT scores and poverty. In the state of Florida,...Ch. 11 - Monetary values of NFL teams. Refer to the Forbes...Ch. 11 - Evaluating a truck weigh-in-motion program. The...Ch. 11 - Energy efficiency of buildings. Firms conscious of...Ch. 11 - Forecasting managerial needs. Managers are an...Ch. 11 - Prob. 11.118ACACh. 11 - Prob. 11.119CTCCh. 11 - Prob. 11.120CTC
Knowledge Booster


Learn more about
Need a deep-dive on the concept behind this application? Look no further. Learn more about this topic, statistics and related others by exploring similar questions and additional content below.Similar questions
- Not sure how to figure out the slope and y-interceptarrow_forwardYpsilanti Market Research conducted a survey to find out whether people who earn more money purchase more expensive goods. The following graph indicates the relationship between income the survey subjects earned and the price of the car that they purchased. The variable shown on the vertical axis is __________ (options: thousands of dollars per car, thousands of dollars per year, income, thousands of dollars, price, number of goods). The units for the variable on the horizontal axis are _________ (options: thousands of dollars per car, thousands of dollars per year, income, thousands of dollars, price, number of goods). There are two ways to view the information presented on the graph. First, the graph tells us the amount a person with a certain income is likely to spend on a car, and second, it tells us the probable income of a person who spent a certain amount on a car. For example, if an individual earned $50,000 last year and purchased a new car, you would expect that person to…arrow_forwardGiven the following data table: X Y 21 68 72 55 38 59 57 57 45 61 What is the correlation between X and Y? Include 3 decimal places in your answer.arrow_forward
- Econometrics Thomas Eisensee and David Stromberg wanted to measure how much news coverage of a foreign disaster impacted the amount of disaster relief provided by the U.S. government. They argue that the simple relationship would be biased. Let X = Minutes of News Coverage and Y= Disaster Aid. Choose a variable X2 that could bias the simple relationship. This variable should impact the amount of coverage and impact the amount of aid for reasons other than purely news coverage. Eisensee and Stromberg introduce an instrument Z = During the Olympics. Explain how Z could satisfy the relevant and exogenous criteria. Explain how you could use Z to estimate the impact of X on Y free from X2 bias. Hint: you should mention two stages.arrow_forwardThe graph shows a relationship between two variables, x and y What is the slope of the relationship at point A? >>> The graph will plot data needed to answer this question The slope of the relationship at point A is >>>If the slope is negative, use a minus sign. If the slope is positive, do not use a plus sign 70- 00- 50- 40- 304 20- 10- y 30 >>> Click on the graph to work out the answer Time Remaining: 01:00:48 €arrow_forwardDraw the graph of U = q1 + aq2 and U= q1^2 + q2^2. Interpret the parameter and shape of the curve.arrow_forward
- The accompanying data gives the high and low temperatures in January for a random sample of 50 cities. a. Decide whether use of the linear correlation coefficient as a descriptive measure for the data is appropriate. b. If appropriate, obtain the linear correlation coefficient. c. If appropriate, interpret the value of r in terms of the linear relationship between the two variables. Click the icon to view the High and Low data values. a. The linear correlation coefficient as a descriptive measure for the data appropriate because b. Select the correct choice and, if necessary, fill in the answer box to complete your choice. OA. The linear correlation coefficient is (Round to three decimal places as needed.) O B. The linear correlation coefficient as a descriptive measure for the data is not appropriate. c. Choose the correct answer below. O A. There appears to be a strong negative linear association between the two variables. OB. There appears to be a weak negative linear association…arrow_forwardAccording to the following given information how to determine: 12 3 4 5 6 7 8 9 10 11 11 12 13 12 13 14 15 970 1,180 1,239 1,293 1,350 1,398 1,410 1,480 1,492 1,500 1,520 1,592 1,605 1,660 1,685 A) Break Even-point or points? B) How is to construct the relationship between entire variables through the simple drawing for all above figures and highlighting of Break Even point the drawing? C) Justify your final answer for each line of production. Production Times (months) product of (Z unit)arrow_forwardWhat type pf correlation does the graph show ?arrow_forward
- The following graph contains four lines (A, B, C and D), each of which has a slope that is either positive, negative, zero, or infinite. Y-axisX-axisBDCA For each of the following scenarios, indicate whether the relationship between the two variables is positive or negative, as well as which line on the previous graph has a slope that reflects this type of relationship. Hint: The X-axis and Y-axis on the graph are not labeled intentionally. You need to substitute the variables from each scenario for the horizontal and vertical axis. For example, in the first scenario, X-axis should be labeled “ ice-cream" and Y-axis should be labeled "The temperature". Scenario Relationship Line As the temperature rises, the demand for ice-cream rises. Negative As the temperature rises, the demand for hot cocoa falls. Positive As the temperature falls, the demand for popsicles falls. Negative True or False: Line B has a slope of infinity.…arrow_forwardIf you plot temperature on the y axis and time on the x axis, you have created a A. bar chart. B. scatter plot. C. time series. D. pie chart.arrow_forwardConsider the following summary statistics of the variables x, y and z var(x) = 2.4, var(y)=3.2, var(z) =1.1 cov(x,y) = 3.1, cov(x,z) = 4.2, cov(y,z) = 8 What is the instrumental variable (IV) estimator of the effect of x on y when you use the variable z as an instrumental variable?arrow_forward
arrow_back_ios
SEE MORE QUESTIONS
arrow_forward_ios
Recommended textbooks for you


 Economics (MindTap Course List)EconomicsISBN:9781337617383Author:Roger A. ArnoldPublisher:Cengage Learning
Economics (MindTap Course List)
Economics
ISBN:9781337617383
Author:Roger A. Arnold
Publisher:Cengage Learning
Correlation Vs Regression: Difference Between them with definition & Comparison Chart; Author: Key Differences;https://www.youtube.com/watch?v=Ou2QGSJVd0U;License: Standard YouTube License, CC-BY
Correlation and Regression: Concepts with Illustrative examples; Author: LEARN & APPLY : Lean and Six Sigma;https://www.youtube.com/watch?v=xTpHD5WLuoA;License: Standard YouTube License, CC-BY