
Videos
a.
Check whether the data provide convincing support for the claim that, on average, male teenager drivers exceed the speed limit by more than do female teenage drivers.
a.
Answer to Problem 18E
The conclusion is that the data provide convincing support for the claim that, on average, male teenager drivers exceed the speed limit by more than do female teenage drivers.
Explanation of Solution
Calculation:
The data are based on the speed limit for male and female drivers.
Step 1:
In this context,
Step 2:
Null hypothesis:
Step 3:
Alternative hypothesis:
Step 4:
Significance level,
It is given that the significance level,
Step 5:
Test statistic:
Step 6:
The assumption for the two-sample t-test:
- The random samples should be collected independently.
- The sample sizes should be large. That is, each sample size is at least 30 or the populations are approximately normally distributed.
It is assumed that the distribution of the speed limit for male and female drivers is normally distributed.
Boxplot:
Software procedure:
Step-by-step procedure to obtain a boxplot using MINITAB software:
- Choose Graphs > Boxplot.
- Under Multiple Y’s, choose Simple.
- In Graph variables, enter the column of Male Driver and Female Driver.
- In Scale, choose Transpose values and categorical scales.
- Click OK in all dialogue boxes.
Output using MINITAB software is given below:
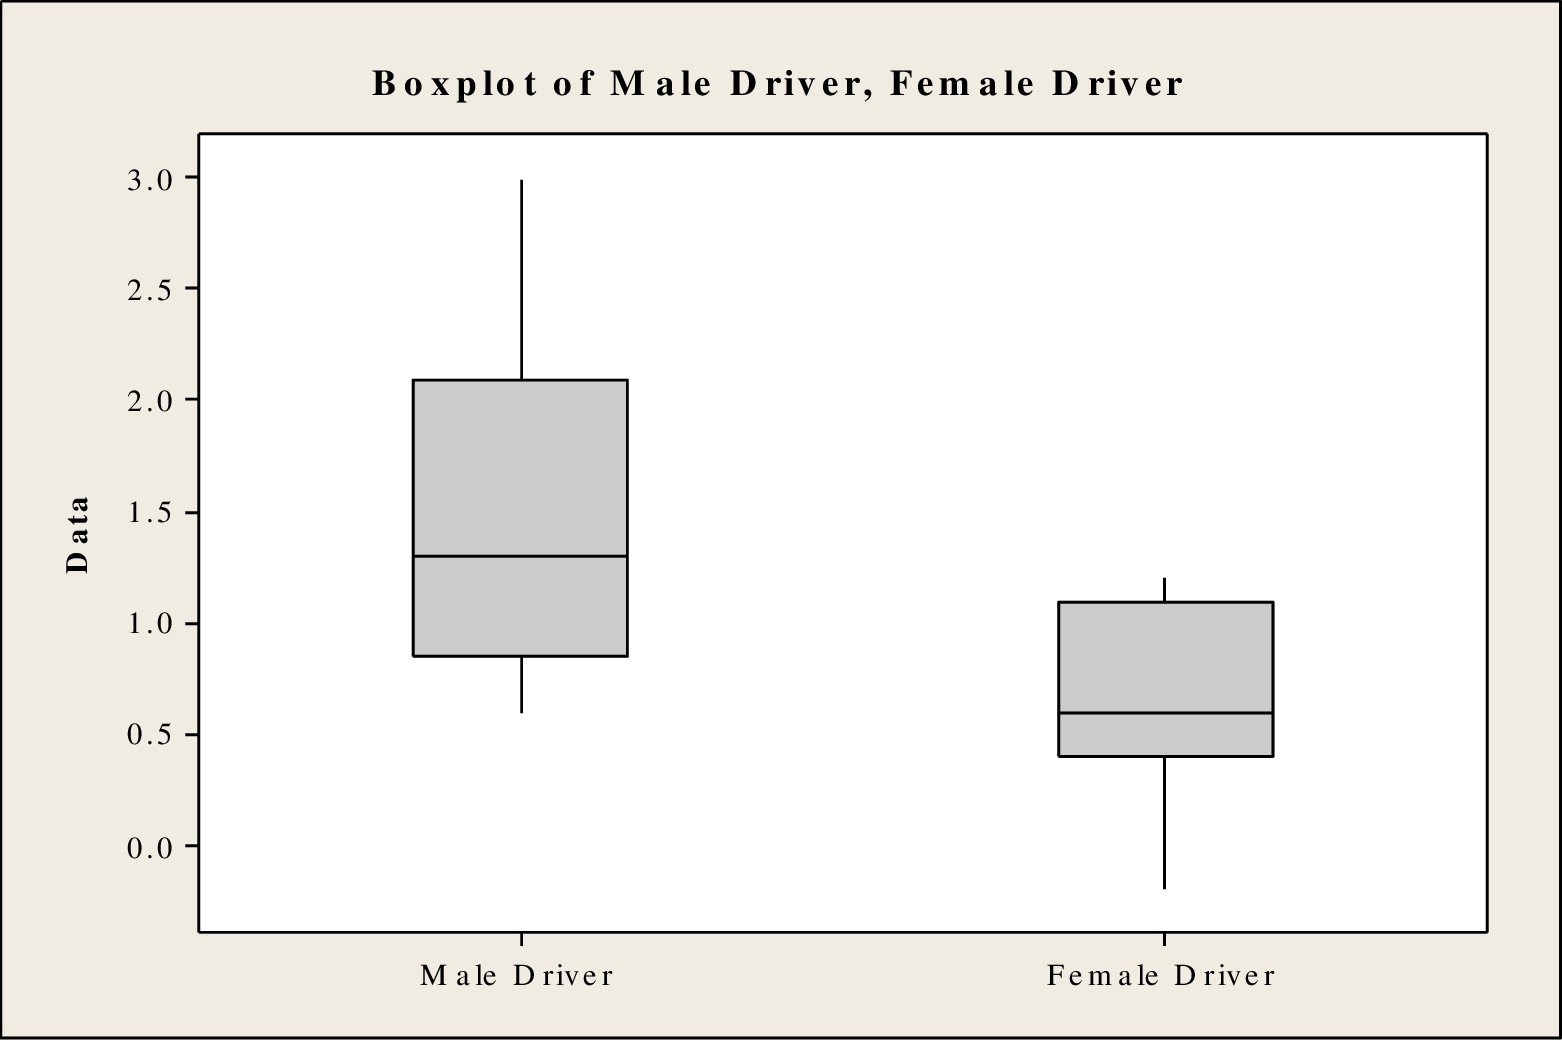
Any lack of symmetric that appears in the boxplot is acceptable for the given sample size because the sample size is larger.
From the boxplot, it is clear that the distribution of the speed limit for male drivers is skewed right and the distribution of the speed limit for female drivers is skewed left. Based on the sample size, the normality condition is satisfied. Morevoer, random samples are collected independently. Therefore, the assumptions are satisfied. It is reasonable to use the data for a two-sample t test.
Step 7:
Test statistic:
Software procedure:
Step-by-step procedure to obtain the P-value and test statistic using MINITAB software:
- Choose Stat > Basic Statistics > 2 sample t.
- Choose Samples in different columns.
- In sample 1, enter the column of Male Driver.
- In sample 2, enter the column of Female Driver.
- Choose Options.
- In Confidence level, enter 95.
- In Alternative, select greater than.
- Click OK in all the dialogue boxes.
Output obtained using MINITAB software is given below:
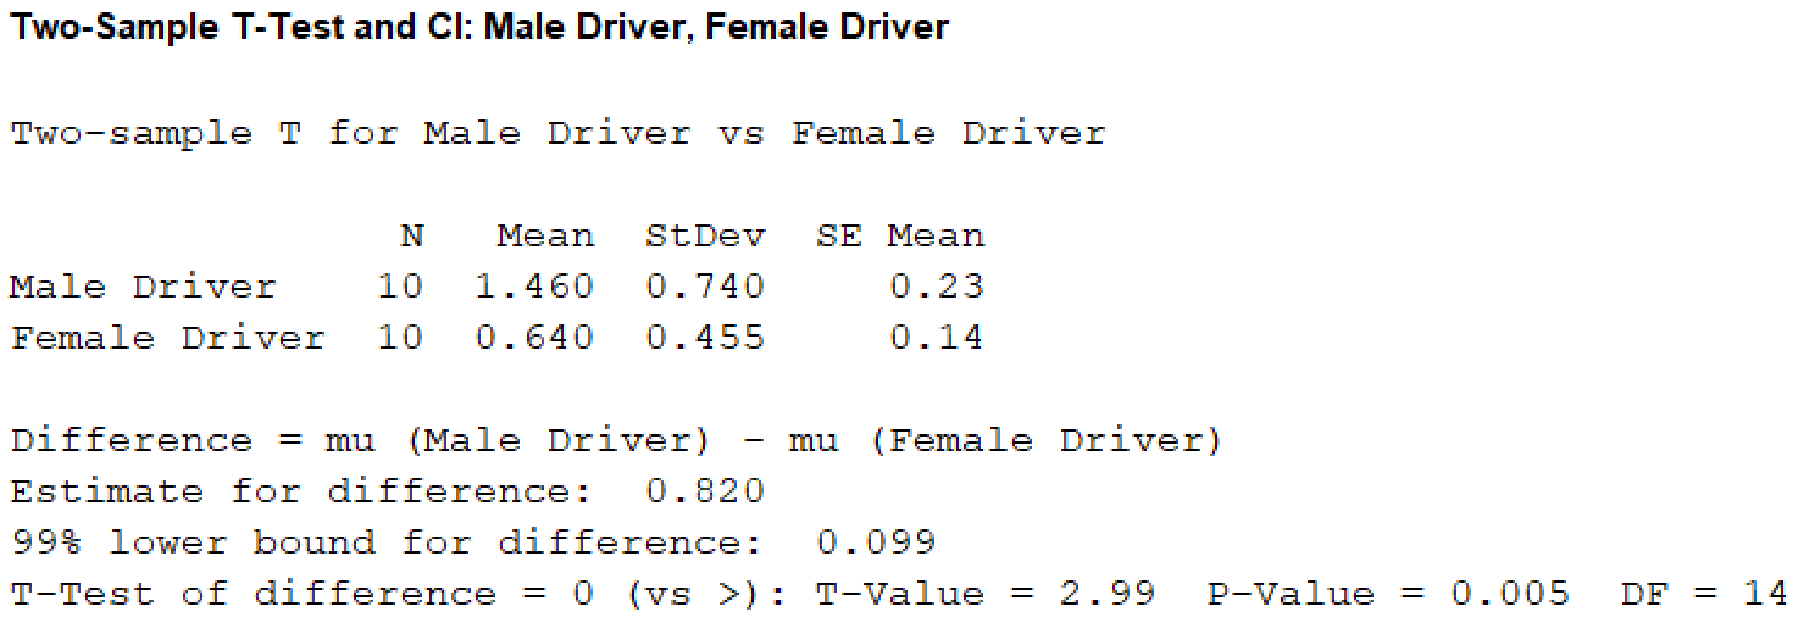
From the given MINITAB output, the value of the test statistic is 2.99.
Step 8:
P-value:
From the MINITAB output, the P-value is 0.005.
Step 9:
Decision rule:
If the
Here, the
That is,
The decision is that the null hypothesis is rejected.
Conclusion:
Hence, the data provide convincing support for the claim that, on average, male teenager drivers exceed the speed limit by more than do female teenage drivers.
b.
(i)
Check whether there is sufficient evidence to conclude that the average number of miles per hour over the speed limit is greater for male drivers with male passengers than it is for male drivers with female passengers.
(ii)
Check whether there is sufficient evidence to conclude that the average number of miles per hour over the speed limit is greater for female drivers with male passengers than it is for female drivers with female passengers.
(iii)
Check whether there is sufficient evidence to conclude that the average number of miles per hour over the speed limit is smaller for male drivers with female passengers than it is for female drivers with male passengers.
b.
Answer to Problem 18E
(i)
The conclusion is that there is sufficient evidence to conclude that the average number of miles per hour over the speed limit is greater for male drivers with male passengers than it is for male drivers with female passengers.
(ii)
The conclusion is that there is sufficient evidence to conclude that the average number of miles per hour over the speed limit is greater for female drivers with male passengers than it is for female drivers with female passengers.
(iii)
The conclusion is that there is sufficient evidence to conclude that the average number of miles per hour over the speed limit is smaller for male drivers with female passengers than it is for female drivers with male passengers.
Explanation of Solution
Calculation:
(i)
Step 1:
In this context,
Step 2:
Null hypothesis:
Step 3:
Alternative hypothesis:
Step 4:
Significance level,
It is given that the significance level
Step 5:
Test statistic:
Step 6:
Assumptions for the two-sample t-test:
- The random samples should be collected independently.
- The sample sizes should be large. That is, each sample size must be at least 30.
Assumption in this particular problem:
- Data are collected independently.
- The sample sizes are large.
Here, both sample sizes are greater than 30.
Therefore, the assumptions are satisfied.
Step 7:
Test statistic:
Software procedure:
Step-by-step procedure to obtain the P-value and test statistic using MINITAB software:
- Choose Stat > Basic Statistics > 2 sample t.
- Choose Summarized data.
- In sample 1, enter Sample size as 40, Mean as 5.2, Standard deviation as 0.8.
- In sample 2, enter Sample size as 40, Mean as 0.3, Standard deviation as 0.8.
- Choose Options.
- In Confidence level, enter 99.
- In Alternative, select greater than.
- Click OK in all the dialogue boxes.
Output obtained using MINITAB software is given below:
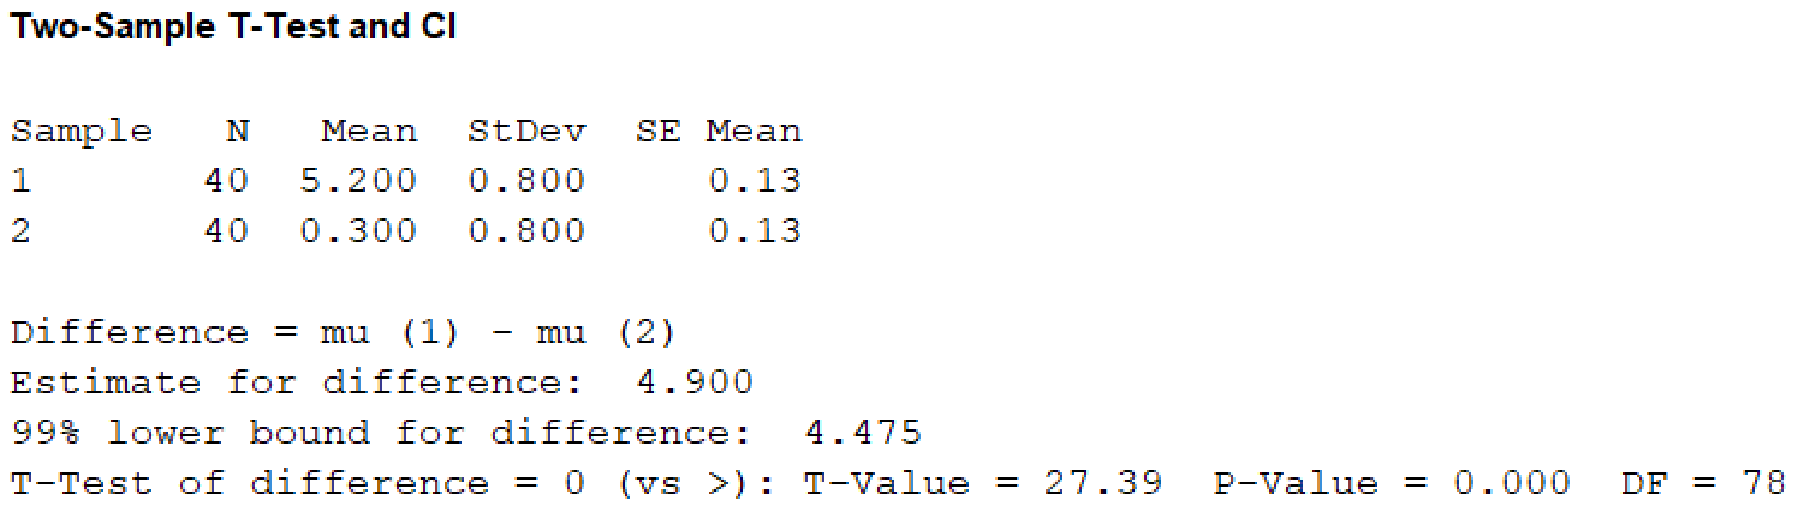
From the given MINITAB output, the value of test statistic is 27.39.
Step 8:
P-value:
From the MINITAB output, the P-value is 0.
Step 9:
Decision rule:
If the
Here, the
That is,
The decision is that the null hypothesis is rejected.
Conclusion:
Hence, there is sufficient evidence to conclude that the average number of miles per hour over the speed limit is greater for male drivers with male passengers than it is for male drivers with female passengers.
(ii)
Step 1:
In this context,
Step 2:
Null hypothesis:
Step 3:
Alternative hypothesis:
Step 4:
Significance level,
It is given that the significance level
Step 5:
Test statistic:
Step 6:
Assumptions for the two-sample t-test:
- The random samples should be collected independently.
- The sample sizes should be large. That is, each sample size must be at least 30.
Assumption in this particular problem:
- Data are collected independently.
- The sample sizes are large.
Here, both sample sizes are greater than 30.
Therefore, the assumptions are satisfied.
Step 7:
Test statistic:
Software procedure:
Step-by-step procedure to obtain the P-value and test statistic using MINITAB software:
- Choose Stat > Basic Statistics > 2 sample t.
- Choose Summarized data.
- In sample 1, enter Sample size as 40, Mean as 2.3, Standard deviation as 0.8.
- In sample 2, enter Sample size as 40, Mean as 0.6, Standard deviation as 0.8.
- Choose Options.
- In Confidence level, enter 99.
- In Alternative, select greater than.
- Click OK in all the dialogue boxes.
Output obtained using MINITAB software is given below:
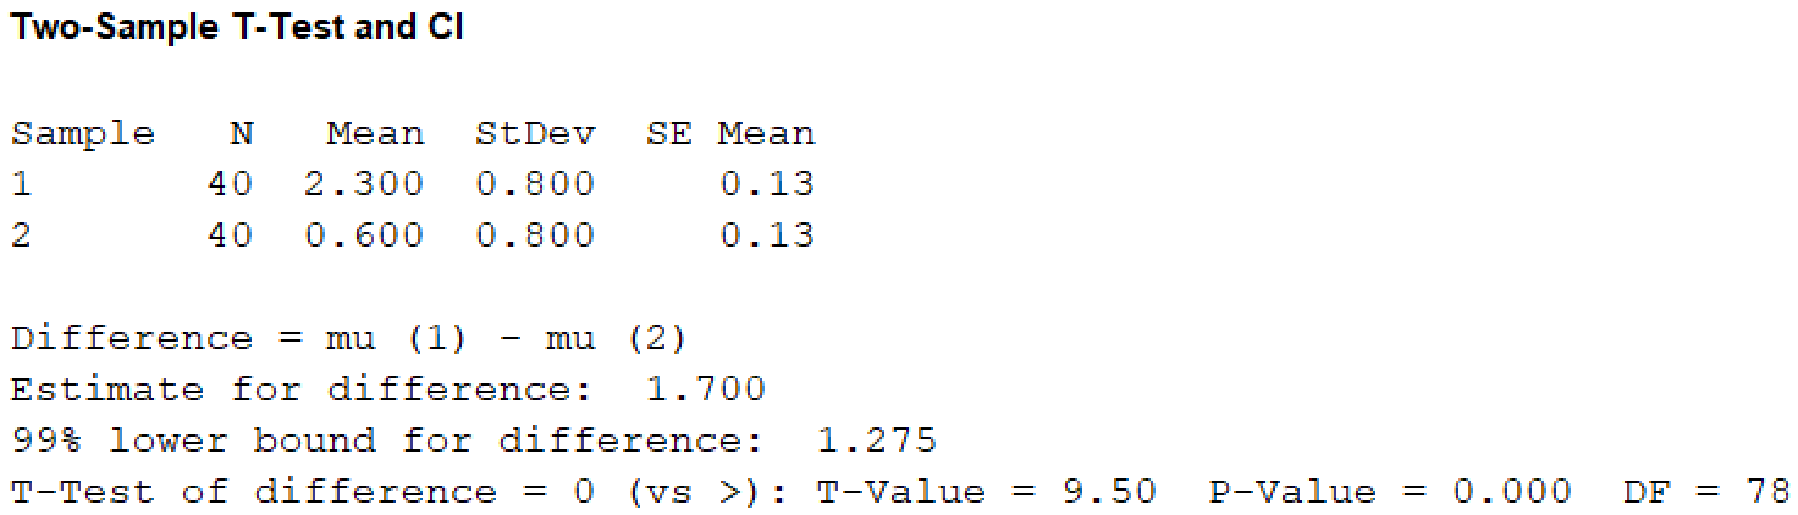
From the given MINITAB output, the value of test statistic is 9.50.
Step 8:
P-value:
From the MINITAB output, the P-value is 0.
Step 9:
Decision rule:
If the
Here, the
That is,
The decision is that the null hypothesis is rejected.
Conclusion:
Hence, there is sufficient evidence to conclude that the average number of miles per hour over the speed limit is greater for female drivers with male passengers than it is for female drivers with female passengers.
(iii)
Step 1:
In this context,
Step 2:
Null hypothesis:
Step 3:
Alternative hypothesis:
Step 4:
Significance level,
It is given that the significance level
Step 5:
Test statistic:
Step 6:
Assumptions for the two-sample t-test:
- The random samples should be collected independently.
- The sample sizes should be large. That is, each sample size must be at least 30.
Assumption in this particular problem:
- Data are collected independently.
- The sample sizes are large.
Here, both sample sizes are greater than 30.
Therefore, the assumptions are satisfied.
Step 7:
Test statistic:
Software procedure:
Step-by-step procedure to obtain the P-value and test statistic using MINITAB software:
- Choose Stat > Basic Statistics > 2 sample t.
- Choose Summarized data.
- In sample 1, enter Sample size as 40, Mean as 0.3, Standard deviation as 0.8.
- In sample 2, enter Sample size as 40, Mean as 2.3, Standard deviation as 0.8.
- Choose Options.
- In Confidence level, enter 99.
- In Alternative, select less than.
- Click OK in all the dialogue boxes.
Output obtained using the MINITAB software is given below:
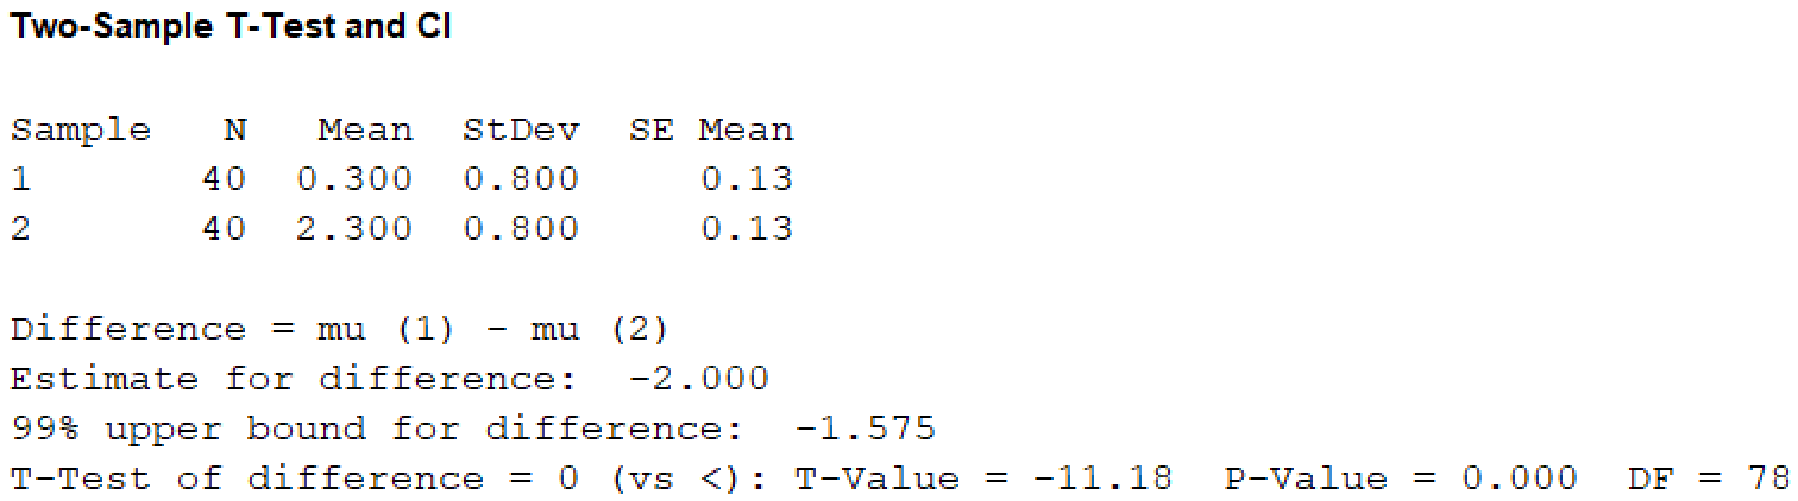
From the given MINITAB output, the value of test statistic is –11.18.
Step 8:
P-value:
From the MINITAB output, the P-value is 0.
Step 9:
Decision rule:
If the
Here, the
That is,
The decision is that the null hypothesis is rejected.
Conclusion:
Hence, there is sufficient evidence to conclude that the average number of miles per hour over the speed limit is smaller for male drivers with female passengers than it is for female drivers with male passengers.
c.
Comment on the effects of gender on teenagers driving with passengers.
c.
Explanation of Solution
Comment:
From the results, it is observed that the average speed limit for male and female drivers are greater with male passengers when compared to the female passengers. The average speed limit for male drivers are lesser with female passengers when compared to the female drivers with male passengers. The average speed limit for male drivers are greater with male passengers when compared to the female drivers with female passengers.
Want to see more full solutions like this?
Chapter 11 Solutions
Introduction to Statistics and Data Analysis


 Glencoe Algebra 1, Student Edition, 9780079039897...AlgebraISBN:9780079039897Author:CarterPublisher:McGraw Hill
 Big Ideas Math A Bridge To Success Algebra 1: Stu...AlgebraISBN:9781680331141Author:HOUGHTON MIFFLIN HARCOURTPublisher:Houghton Mifflin Harcourt
 College Algebra (MindTap Course List)AlgebraISBN:9781305652231Author:R. David Gustafson, Jeff HughesPublisher:Cengage Learning