Concept explainers
Videos
(a)
Find the level of significance.
State the null and alternative hypothesis.
(a)
Answer to Problem 11P
The level of significance is 0.01.
Explanation of Solution
Calculation:
From the given information the value of
Hence, the level of significance is 0.01.
The null and alternative hypothesis is,
Null hypothesis:
Alternative hypothesis:
(b)
Identify the sampling distribution to be used.
Find the value of the sample test statistic.
(b)
Answer to Problem 11P
The sampling distribution to be used is
The value of the sample test statistic is 0.
Explanation of Solution
Calculation:
Conditions:
The conditions for using the normal distribution to test a proportion p with proportion of success
The sample statistic has the normal distribution with mean p, and standard deviation
Test statistic:
The z value for the sample test statistic x is,
In the formula n is the total number of plus and minus signs, x is the total number of plus signs divided by n, p is proportion specified in
The sign is obtained by taking the difference of males and females. If the difference is positive then assign ‘+’ to the corresponding data pair. If the difference is negative then assign ‘–’ to the corresponding data pair. If the difference is zero then remove the data pair from the calculation.
The standard normal distribution is used as the sampling distribution for the sign test.
The signs are,
| Region | Male | Female | Difference | Sign of difference |
| 1 | 7.3 | 7.5 | –0.2 | – |
| 2 | 7.5 | 6.4 | 1.1 | + |
| 3 | 7.7 | 6.0 | 1.7 | + |
| 4 | 21.8 | 20.0 | 1.8 | + |
| 5 | 4.2 | 2.6 | 1.6 | + |
| 6 | 12.2 | 5.2 | 7.0 | + |
| 7 | 3.5 | 3.1 | 0.4 | + |
| 8 | 4.2 | 4.9 | –0.7 | – |
| 9 | 8.0 | 12.1 | –4.1 | – |
| 10 | 9.7 | 10.8 | –1.1 | – |
| 11 | 14.1 | 15.6 | –1.5 | – |
| 12 | 3.6 | 6.3 | –2.7 | – |
| 13 | 3.6 | 4.0 | –0.4 | – |
| 14 | 4.0 | 3.9 | 0.1 | + |
| 15 | 5.2 | 9.8 | –4.6 | – |
| 16 | 6.9 | 9.8 | –2.9 | – |
| 17 | 15.6 | 12.0 | 3.6 | + |
| 18 | 6.3 | 3.3 | 3.0 | + |
| 19 | 8.0 | 7.1 | 0.9 | + |
| 20 | 6.5 | 8.2 | –1.7 | – |
There are ten positive signs and totally 20 positive and negative signs are there.
The value of x is,
The value of x is 0.5.
Test statistic:
Substitute x as 0.5, and n as 20 in the test statistic formula
Hence, the z value is 0.
(c)
Find the P-value of the sample test statistic.
(c)
Answer to Problem 11P
The P-value is 1.00.
Explanation of Solution
Calculation:
Step by step procedure to obtain P-value using MINITAB software is given below:
- Choose Graph > Probability Distribution Plot choose View Probability > OK.
- From Distribution, choose ‘Normal’ distribution.
- Click the Shaded Area tab.
- Choose X Value and Both Tail, for the region of the curve to shade.
- Enter the X value as 0.
- Click OK.
Output using MINITAB software is given below:
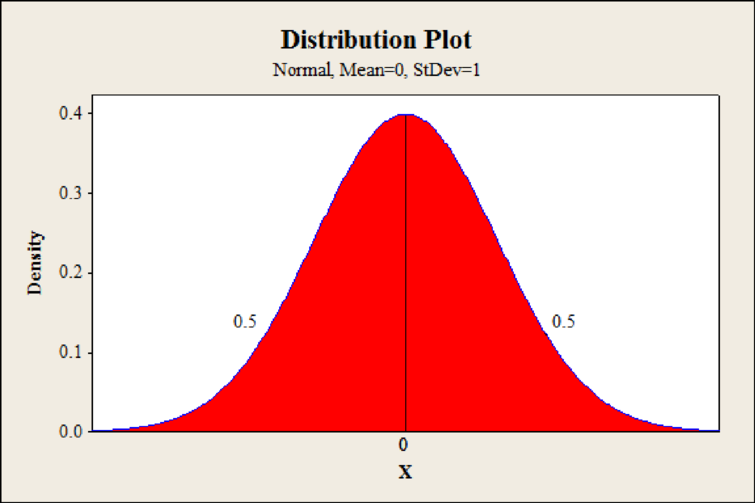
From Minitab output, the P-value is 0.5 which is one sided value.
The two-tailed P-value is,
Hence, the P-value is 1.00.
(d)
Mention the conclusion of the test.
(d)
Answer to Problem 11P
The null hypothesis is failed to be rejected.
Explanation of Solution
Calculation:
From part (c), the P-value is 1.00.
Rejection rule:
- If the P-value is less than or equal to
Conclusion:
The P-value is 1.00 and the level of significance is 0.01.
The P-value is greater than the level of significance.
That is,
By the rejection rule, the null hypothesis is failed to be rejected.
Hence, the data is not statistically significant at level 0.01.
(e)
Interpret the conclusion in the context of the application.
(e)
Explanation of Solution
Calculation:
From part (d), the null hypothesis is failed to be rejected. This shows that, there is no sufficient evidence that the distribution of the dropout rates for males and females are different at level of significance 0.01.
Want to see more full solutions like this?
Chapter 11 Solutions
WebAssign Printed Access Card for Brase/Brase's Understandable Statistics: Concepts and Methods, 12th Edition, Single-Term


- 120 110 110 100 90 80 Total Score Scatterplot of Total Score vs. Putts grit bas 70- 20 25 30 35 40 45 50 Puttsarrow_forward10 15 Answer the following, using the figures and tables from the temperature versus coffee sales data from Questions 1 and 11: a. How many coffees should the manager prepare to make if the temperature is 32°F? b. As the temperature drops, how much more coffee will consumers purchase?ov (Hint: Use the slope.) 21 bru sug c. For what temperature values does the voy marw regression line make the best predictions? al X al 1090391-Yrit,vewolf 30-X Inlog arts bauoxs 268 PART 4 Statistical Studies and the Hunt forarrow_forward18 Using the results from the rainfall versus corn production data in Question 14, answer DOV 15 the following: a. Find and interpret the slope in the con- text of this problem. 79 b. Find the Y-intercept in the context of this problem. alb to sig c. Can the Y-intercept be interpreted here? (.ob or grinisiques xs as 101 gniwollol edt 958 orb sz) asiques sich ed: flow wo PEMAIarrow_forward
- Variable Total score (Y) Putts hit (X) Mean. 93.900 35.780 Standard Deviation 7.717 4.554 Correlation 0.896arrow_forward17 Referring to the figures and tables from the golf data in Questions 3 and 13, what hap- pens as you keep increasing X? Does Y increase forever? Explain. comis word ே om zol 6 svari woy wol visy alto su and vibed si s'ablow it bas akiog vino b tad) beil Bopara Aon csu How wod griz -do 30 義arrow_forwardVariable Temperature (X) Coffees sold (Y) Mean 35.08 29,913 Standard Deviation 16.29 12,174 Correlation -0.741arrow_forward
- 13 A golf analyst measures the total score and number of putts hit for 100 rounds of golf an amateur plays; you can see the summary of statistics in the following table. (See the figure in Question 3 for a scatterplot of this data.)noitoloqpics bella a. Is it reasonable to use a line to fit this data? Explain. 101 250 b. Find the equation of the best fitting 15er regression line. ad aufstuess som 'moob Y lo esulav in X ni ognado a tad Variable on Mean Standard Correlation 92 Deviation Total score (Y) 93.900 7.717 0.896 Putts hit (X) 35.780 4.554 totenololbenq axlam riso voy X to asulisy datdw gribol anil er 08,080.0 zl noitsism.A How atharrow_forwardVariable Bone loss (Y) Age (X) Mean 35.008. 67.992 Standard Deviation 7.684 10.673 Correlation 0.574arrow_forward50 Bone Loss 30 40 20 Scatterplot of Bone Loss vs. Age . [902) 10 50 60 70 80 90 Age a sub adi u xinq (20) E 4 adw I- nyd med ivia .0 What does a scatterplot that shows no linear relationship between X and Y look like?arrow_forward
- Variable Temperature (X) Coffees sold (Y) Mean 35.08 29,913 Standard Deviation 16.29 12,174 Correlation -0.741arrow_forward2 Find and interpret the value of r² for the rainfall versus corn data, using the table from Question 14.2291992 b sgen gnome vixists 992 ms up? 2910 1999 bio .blos estos $22 tolqis2 qs rieds ni zoti swoH iisqa vilsen od 1'meo DOV to mogers boangas mus jil Reustar enou Leption20th ) abnuin Hagodt graub 032 Carrow_forward18 Using the results from the rainfall versus corn production data in Question 14, answer oy the following: DOY 98 103 LA Find and interpret the slope in the con- text of this problem. b. Find the Y-intercept in the context of this problem. roy gatiigisve Toy c. Can the Y-intercept be interpreted here? (.ob o grinisq blo eiqmaxs as 101 galwollol edt 998 ds most notamotni er griau sib 952) siqmaxs steb godt llaw worl pun MAarrow_forward
 Linear Algebra: A Modern IntroductionAlgebraISBN:9781285463247Author:David PoolePublisher:Cengage Learning
 Holt Mcdougal Larson Pre-algebra: Student Edition...AlgebraISBN:9780547587776Author:HOLT MCDOUGALPublisher:HOLT MCDOUGAL
 Big Ideas Math A Bridge To Success Algebra 1: Stu...AlgebraISBN:9781680331141Author:HOUGHTON MIFFLIN HARCOURTPublisher:Houghton Mifflin Harcourt
 Glencoe Algebra 1, Student Edition, 9780079039897...AlgebraISBN:9780079039897Author:CarterPublisher:McGraw Hill