
Concept explainers
Videos
For Exercises 7 and 8: (a) state the decision rule, (b) compute the pooled estimate of the population variance, (c) compute the test statistic, (d) state your decision about the null hypothesis, and (e) estimate the p-value.
8. The null and alternate hypotheses are:
A random sample of 15 observations from the first population revealed a sample mean of 350 and a sample standard deviation of 12. A random sample of 17 observations from the second population revealed a sample mean of 342 and a sample standard deviation of 15. At the .10 significance level, is there a difference in the population means?
a.
Determine the decision rule.
Explanation of Solution
Calculation:
Degrees of freedom:
The degrees of freedom is as follows:
Step-by-step procedure to obtain the critical value using MINITAB software:
- 1. Choose Graph > Probability Distribution Plot choose View Probability > OK.
- 2. From Distribution, choose ‘t’ distribution.
- 3. In Degrees of freedom, enter 30.
- 4. Click the Shaded Area tab.
- 5. Choose P Value and Two Tail for the region of the curve to shade.
- 6. Enter the probability value as 0.05.
- 7. Click OK.
Output obtained using MINITAB software is given below:
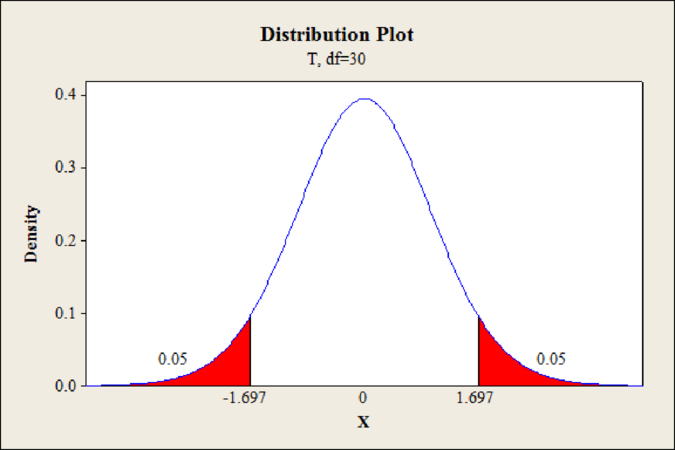
From the MINITAB output, the critical value is
The decision rule is,
If
If
b.
Find the value of the pooled estimate of the population variance.
Answer to Problem 8E
The pooled estimate of the population variance is 187.20.
Explanation of Solution
Calculation:
Pooled estimate:
The pooled estimate of the population variance is as follows:
Substitute
Thus, the pooled estimate of the population variance is 187.20.
c.
Find the value of test statistic.
Answer to Problem 8E
The value of the test statistic is 1.651.
Explanation of Solution
Test statistic:
The test statistic for the hypothesis test of
Substitute
Thus, the test statistic is 1.651.
d.
Determine the decision regarding
Answer to Problem 8E
The decision is fail to reject the null hypothesis.
Explanation of Solution
The critical value is 1.697 and the value of test statistic is 1.651.
The value of test statistic is less than the critical value.
That is,
From the decision rule, fail to reject the null hypothesis.
e.
Find the p-value.
Answer to Problem 8E
The p-value is 0.109.
Explanation of Solution
The p-value is obtained below:
Step-by-step procedure to obtain the p-value using MINITAB software:
- 1. Choose Graph > Probability Distribution Plot choose View Probability > OK.
- 2. From Distribution, choose ‘t’ distribution.
- 3. In Degrees of freedom, enter 30.
- 4. Click the Shaded Area tab.
- 5. Choose X Value and Two Tail for the region of the curve to shade.
- 6. Enter the X value as 1.651.
- 7. Click OK.
Output obtained using MINITAB software is given below:
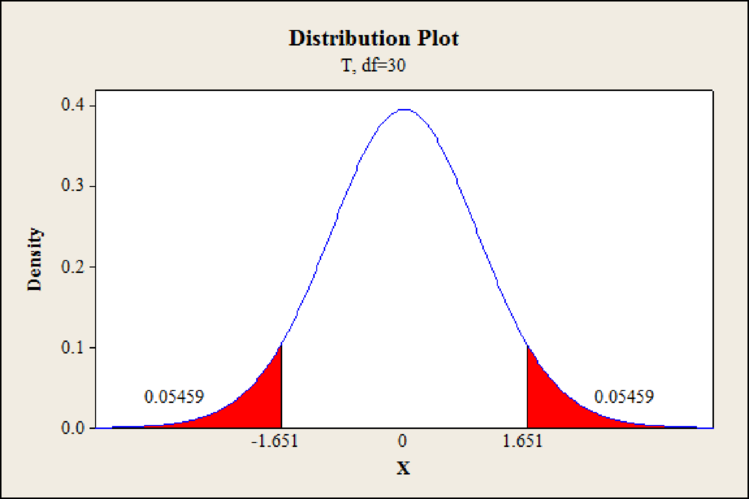
From the MINITAB output, the p-value for one side is 0.05459.
Thus, the p-value is 0.109.
Want to see more full solutions like this?
Chapter 11 Solutions
EBK STATISTICAL TECHNIQUES IN BUSINESS


 Calculus For The Life SciencesCalculusISBN:9780321964038Author:GREENWELL, Raymond N., RITCHEY, Nathan P., Lial, Margaret L.Publisher:Pearson Addison Wesley,