
Videos
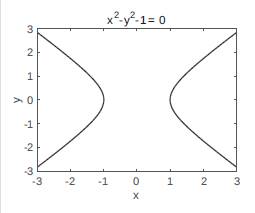
In rectangular coordinates the equation of the hyperbola shown in the figure is given by:
x2-y2=1
(a) Use MATLAB to show that in parametric form the equation of the hyperbola can be written as:
(b) Make a plot of the hyperbola for the domain shown in the figure by using the ezplot command.
Want to see the full answer?
Check out a sample textbook solution
Chapter 11 Solutions
MATLAB: An Introduction with Applications


 Algebra & Trigonometry with Analytic GeometryAlgebraISBN:9781133382119Author:SwokowskiPublisher:Cengage

 College Algebra (MindTap Course List)AlgebraISBN:9781305652231Author:R. David Gustafson, Jeff HughesPublisher:Cengage Learning
 College AlgebraAlgebraISBN:9781305115545Author:James Stewart, Lothar Redlin, Saleem WatsonPublisher:Cengage Learning
 Algebra for College StudentsAlgebraISBN:9781285195780Author:Jerome E. Kaufmann, Karen L. SchwittersPublisher:Cengage Learning