Explain the difference between zero crowding out, incomplete crowding out, and complete crowding out effect.
Explanation of Solution
Zero crowding out: In zero crowding out effect, the government increases spending, but the private sector spending remains constant.
Incomplete crowding out: In incomplete crowding out, the government increases spending, then there is less than the proportionate decrease in price sector spending.
Complete crowding out: In complete crowding out effect, if the government increases spending, then there is an equal decrease in private sector spending.
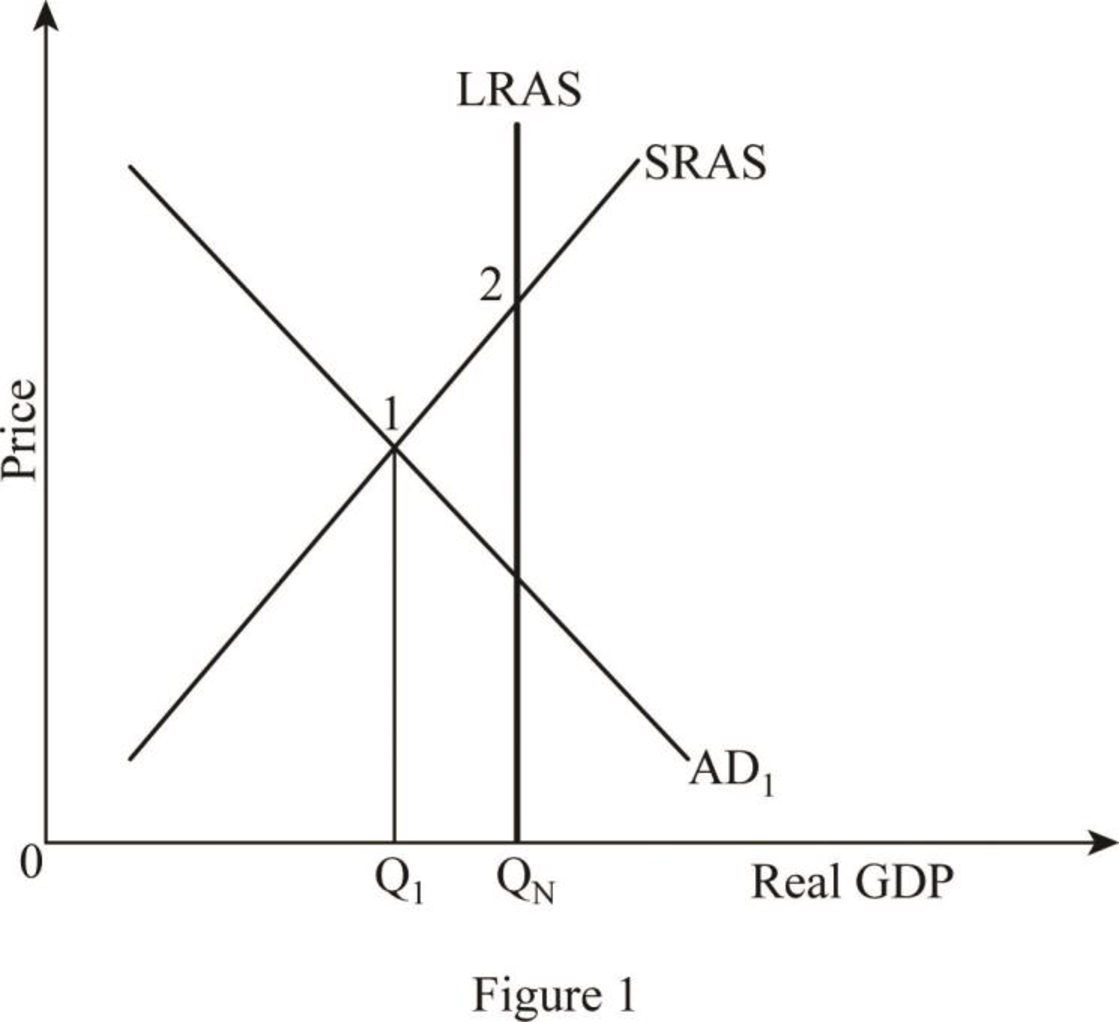
Figure -1 shows the recessionary gap as follows:

In Figure -1, the recessionary gap occurs at point 1. Here, a fall in private expenditure offsets the initial increase in aggregate
Want to see more full solutions like this?
Chapter 11 Solutions
Macroeconomics (Book Only)
- Section 1 Answer all questions. Show all your workings. (a) Suppose there are two firms 1 and 2, whose abatement costs are given by c₁(e₁) and c₂ (e₂), where e denotes emissions and subscripts denote the firm. We assume that c{(e;) 0 for i = 1,2 and for any level of emission e we have c₁'(e) # c₂'(e). Furthermore, assume the two firms make different contributions towards pollution concentration in a nearby river captured by the transfer coefficients ε₁ and 2 such that for any level of emission e we have 2(e) +2 The regulator does not know the resulting C₁'(e) Τι environmental damages. Using an analytical approach explain carefully how the regulator may limit the concentration of pollution using (i) a Pigouvian tax scheme and (ii) uniform emissions standards. Discuss the cost-effectiveness of both approaches to control pollution. [200 marks] (b) "Whether the regulator sells or gives away tradeable emission permits free of charge, the quantities of emissions produced by firms are the…arrow_forwardExotic Coffee for the Poor? What a Genius Idea! you are a business consultant at a coffee shop. Your team leader came to you one morning with excitement on her face and told you, "Guess what? I have an idea for a great location for our next coffee shop. Think about it, Riceville is a city that has 150,000 people. Most of them are above the age of 16, which means they are potential coffee drinkers. Well, even though the majority of people in that city are making minimum wage and are considered poor, but the good news is that there are no coffee shops in Riceville and the only places you could get coffee there either restaurants or gas stations. What do you think?" Knowing that your company’s average drink price is $5.50, and the stores have nice sit-down areas and offer free WIFI and study spaces: What type of information about consumers in that area do you need to gather and understand to determine if people there will actually consume your coffee? How do the concepts of “budget and…arrow_forward(c) Assume an infinite horizon, continuous time and certainty. Furthermore, assume an additively separable utility function in consumption C and pollution stock S so that, U(C,S) = u(C) + v(S), where uc > 0; Ucc 0. Note that the first derivative, and the second subscript denotes the second derivative. The evolution of the pollution stock S over time is a function of consumption, decay rate of the stock of pollution & and abatement through the function, g(S) with gs > 0 and 9ss < 0. Time subscripts are ignored for ease of notation. Show that in the case of a stock pollutant, the marginal utility of consumption should equal the present value of disutility associated with the pollution stock. Interpret the condition.arrow_forward
- Q3/for a closed loop system whose block diagram is shown in the figure determine the values of K and t such that the maximum overshoot to the unit step input is 25% and time to peak is 2 sec K 1+TS $2arrow_forward2. Question The 'Democratic Family' consists of three members {mother m, father f, daughter d}, that have different preferences with respect to how much money X € [0,8] they think should be invested in the new family car. These preferences can be represented by the following utility functions: - Mother m: um(X) = 2X - X² Father f: uf(X) = 10X - X² - Daughter d: ud(X) = 4X - X² Calculate for each family member (f, m, d) the preferred amount of money to invest in the new car denoted by X; for i = {m, f,d}. Assume that (Xf, Xm, Xd) are the three alternatives on which the family must decide. Show that each family member has rational preferences over this domain. Preferences on the family level are determined by pairwise majority voting (all family members vote on two alternatives). Derive the family preference and check whether it is rational. Assume that the final family decision is made by conducting sequential pair- wise majority voting, where the loosing alternative is eliminated. Does…arrow_forward3. Question You invented a new lateral-flow test for asymptomatic Covid-19 detection, where saliva is entered into a test-tube and then the result is shown directly on the device. However, to save on costly chemicals you designed the tests such that it always reports a negative test result. Assume that the incidence rate is 5 per 1000 and that your test is used for detection of asymptomatic cases (without symptoms). (a) Calculate the probability that 100 randomly determined volunteers receive a correct test result by using the AND-rule and the OR-rule. Can your test be qualified as a diagnostic test? (b) The health authorities are investigating the performance of your test. Government guidelines require a specificity (conditional probability to re- ceive a negative test result given that the test-taker is not infected with COVID19) of at least 97% and a sensitivity (conditional probability to receive a positive test result given that the test-taker is infected with COVID-19) of at…arrow_forward
- 3. Question You invented a new lateral-flow test for asymptomatic Covid-19 detection, where saliva is entered into a test-tube and then the result is shown directly on the device. However, to save on costly chemicals you designed the tests such that it always reports a negative test result. Assume that the incidence rate is 5 per 1000 and that your test is used for detection of asymptomatic cases (without symptoms). (a) Calculate the probability that 100 randomly determined volunteers receive a correct test result by using the AND-rule and the OR-rule. Can your test be qualified as a diagnostic test? (b) The health authorities are investigating the performance of your test. Government guidelines require a specificity (conditional probability to re- ceive a negative test result given that the test-taker is not infected with COVID19) of at least 97% and a sensitivity (conditional probability to receive a positive test result given that the test-taker is infected with COVID-19) of at…arrow_forwardI need expert handwritten solutionsarrow_forwardmachine A operated manually cost 2000naira has a life of 2 years, while an automatic machine B cost 5000naira but has a life of 4 years,operating cost for machine A is 4000naira per year while of machine B is 3000naira only, which should be purchased?consider 10% interest I need expert handwritten solutionsarrow_forward


 Economics (MindTap Course List)EconomicsISBN:9781337617383Author:Roger A. ArnoldPublisher:Cengage Learning


